Volume 10, Number 10—October 2004
Research
Syndromic Surveillance for Influenzalike Illness in Ambulatory Care Setting
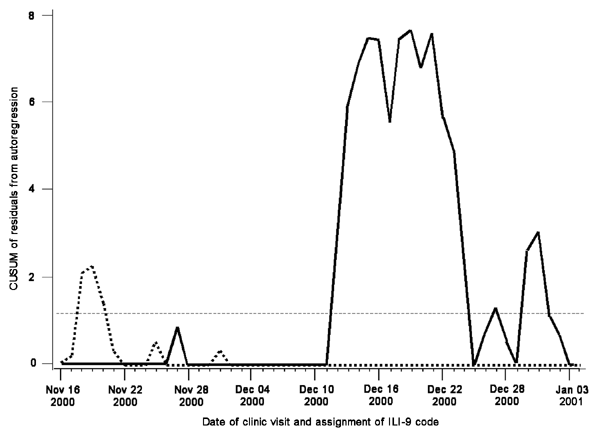
Figure 2

Figure 2. Cumulative sum (CUSUM) chart signaling a significant signal corresponding to a confirmed influenza A outbreak occurring December 2000 and January 2001. CUSUM decision interval (horizontal broken line); CUSUM chart signals 24 days earlier when the analysis is stratified by age: >65 years (dotted line) and all ages (solid line).
Page created: June 15, 2011
Page updated: June 15, 2011
Page reviewed: June 15, 2011
The conclusions, findings, and opinions expressed by authors contributing to this journal do not necessarily reflect the official position of the U.S. Department of Health and Human Services, the Public Health Service, the Centers for Disease Control and Prevention, or the authors' affiliated institutions. Use of trade names is for identification only and does not imply endorsement by any of the groups named above.