Volume 10, Number 10—October 2004
Research
Geographic and Temporal Trends in Influenzalike Illness, Japan, 1992–1999
Takatsugu Sakai* , Hiroshi Suzuki*, Asami Sasaki*, Reiko Saito*, Naohito Tanabe*, and Kiyosu Taniguchi†
Figure 2
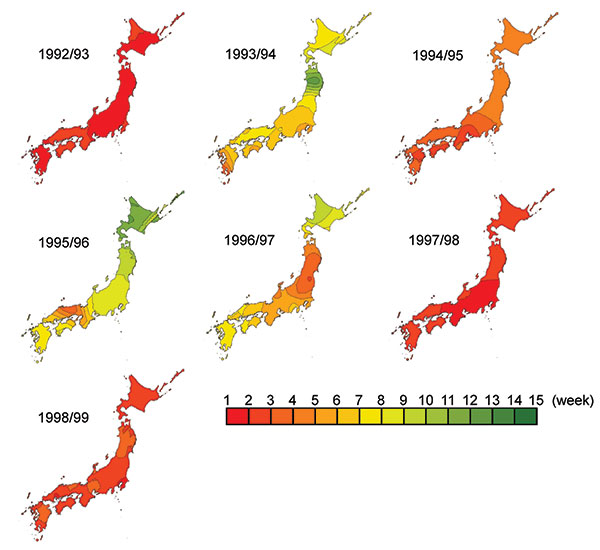
Figure 2. Timing of peak influenzalike illness epidemic activity by week in Japan. The isobars on the contour maps represent interpolated time of peak activity distributed spatially at 1-week intervals. The first week was defined when the peak week was observed first in any one of the prefectures in each season, and then the following weeks were numbered.
Page created: April 11, 2011
Page updated: April 11, 2011
Page reviewed: April 11, 2011
The conclusions, findings, and opinions expressed by authors contributing to this journal do not necessarily reflect the official position of the U.S. Department of Health and Human Services, the Public Health Service, the Centers for Disease Control and Prevention, or the authors' affiliated institutions. Use of trade names is for identification only and does not imply endorsement by any of the groups named above.