Volume 10, Number 4—April 2004
Research
Dengue Spatial and Temporal Patterns, French Guiana, 2001
Annelise Tran* , Xavier Deparis†, Philippe Dussart†, Jacques Morvan†, Patrick Rabarison†, Franck Remy‡, Laurent Polidori*, and Jacques Gardon†
Figure 2
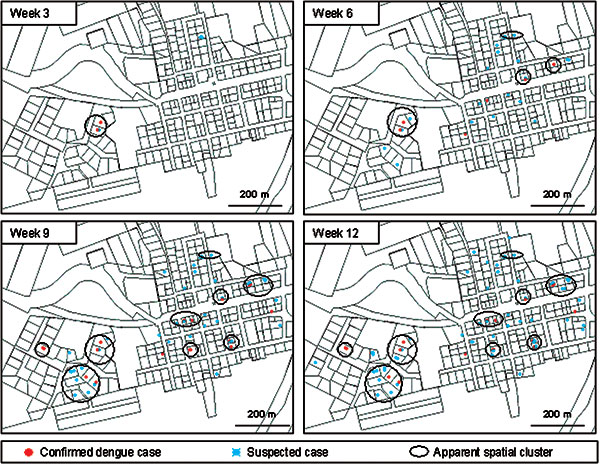
Figure 2. Maps showing locations of dengue patients in Iracoubo center (weeks 3, 6, 9, 12), showing locations of confirmed (red) and suspected (blue) dengue fever patients. Black circles correspond to spatial clusters, that is, neighborhoods where more than two confirmed cases or three suspected cases occurred.
Page created: February 09, 2011
Page updated: February 09, 2011
Page reviewed: February 09, 2011
The conclusions, findings, and opinions expressed by authors contributing to this journal do not necessarily reflect the official position of the U.S. Department of Health and Human Services, the Public Health Service, the Centers for Disease Control and Prevention, or the authors' affiliated institutions. Use of trade names is for identification only and does not imply endorsement by any of the groups named above.