Volume 12, Number 4—April 2006
Research
1951 Influenza Epidemic, England and Wales, Canada, and the United States
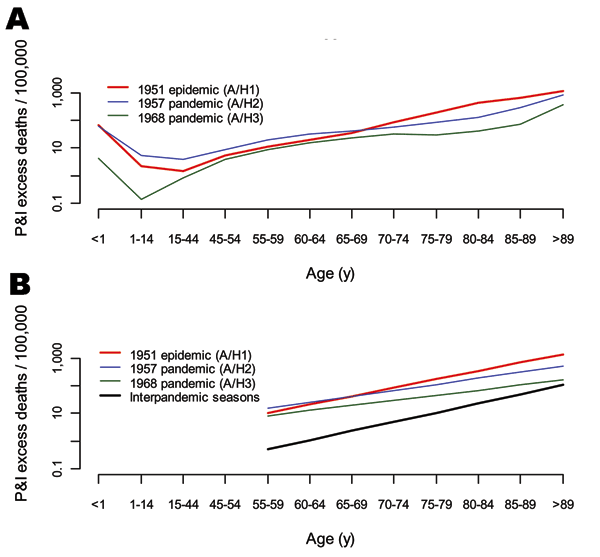
Figure 4

Figure 4. Age-specific pneumonia and influenza (P&I) excess death rates in the 1951 influenza epidemic, 1957, and 1968 pandemics, Canada. A) Observed. B) Exponential models using 5-year age groups starting at age 55 years and ending at >90 years (R2 >0.85 for all seasons). Black curve: "null distribution" of expected pattern in epidemic seasons, based on major epidemics in the interpandemic periods, 1950–1999 (N = 17). The age coefficient was set at the mean of the "null" distribution (see Table 3 for values). The intercept was set at the minimum of the distribution for legibility.
Page created: January 23, 2012
Page updated: January 23, 2012
Page reviewed: January 23, 2012
The conclusions, findings, and opinions expressed by authors contributing to this journal do not necessarily reflect the official position of the U.S. Department of Health and Human Services, the Public Health Service, the Centers for Disease Control and Prevention, or the authors' affiliated institutions. Use of trade names is for identification only and does not imply endorsement by any of the groups named above.