Volume 13, Number 9—September 2007
Research
Effect of Interventions on Influenza A (H9N2) Isolation in Hong Kong’s Live Poultry Markets, 1999–2005
Eric H.Y. Lau*1, Y.H. Connie Leung*1, Li Juan Zhang*, Benjamin J. Cowling*, Sin Ping Mak†, Yi Guan*, Gabriel M. Leung* , and J. S. Malik Peiris*
Figure 3
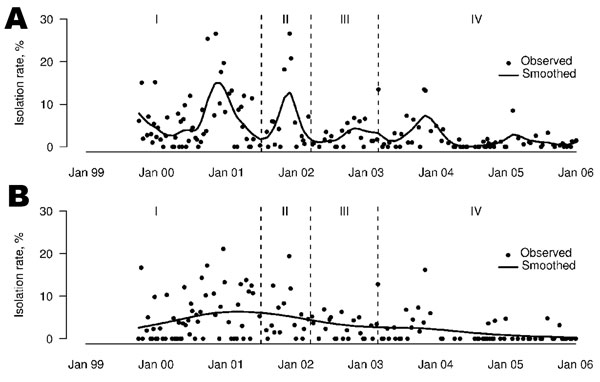
Figure 3. Weekly influenza A (H9N2) isolation rates for chickens (A) and minor poultry (B) in Hong Kong, September 1999–December 2005. Dotted lines denote the different periods: I, no rest-day; II, 1 rest-day with quails sold in live poultry markets; III, 1 rest-day with quails removed from live poultry markets; IV, 2 rest-days.
Page created: July 01, 2010
Page updated: July 01, 2010
Page reviewed: July 01, 2010
The conclusions, findings, and opinions expressed by authors contributing to this journal do not necessarily reflect the official position of the U.S. Department of Health and Human Services, the Public Health Service, the Centers for Disease Control and Prevention, or the authors' affiliated institutions. Use of trade names is for identification only and does not imply endorsement by any of the groups named above.