Skip directly to site content Skip directly to page options Skip directly to A-Z link Skip directly to A-Z link Skip directly to A-Z link
Volume 14, Number 10—October 2008
Dispatch

Control Strategy for Echinococcus multilocularis

Daniel HegglinComments to Author  and Peter Deplazes
Author affiliations: University of Zurich, Zurich, Switzerland;

Main Article

Figure 1

Study area of the anthelminthic baiting experiments in the conurbation of Zurich, Switzerland. Thirteen study plots were defined along the urban periphery during the 2-phased baiting period (phase 1, April 2000–October 2001; phase 2, November 2001–December 2003). Five different treatment schemes were used in these plots: co/co = no bait delivery during the whole study (n = 3 sites of 1 km2 ); b1/b3 = bait delivered monthly during the first phase and trimonthly during the second phase (n = 3); co/b3, no bait delivery during the first and trimonthly delivery during the second phase (n = 3); b1/co, monthly bait delivery during the first and no delivery during the second phase (n = 3); b1/b1, monthly bait delivery during the first and the second phase in a single study plot. This largest study plot comprised initially an area of 6 km2 (gray line) and finally an area of 2 km2 during the second baiting phase.

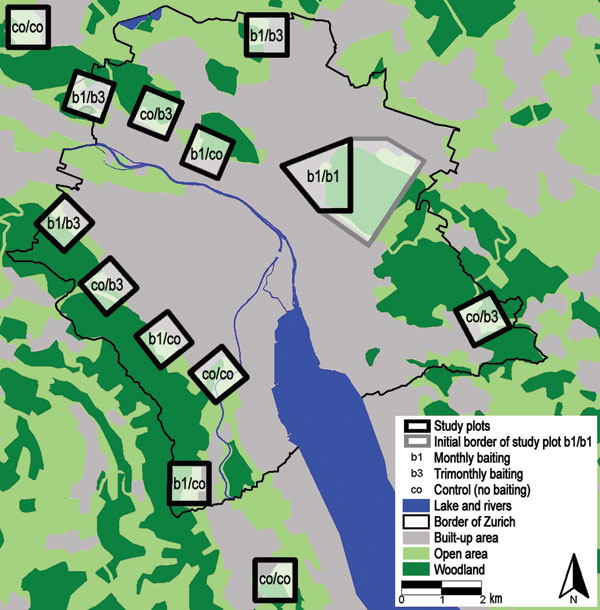
Figure 1. Study area of the anthelminthic baiting experiments in the conurbation of Zurich, Switzerland. Thirteen study plots were defined along the urban periphery during the 2-phased baiting period (phase 1, April 2000–October 2001; phase 2, November 2001–December 2003). Five different treatment schemes were used in these plots: co/co = no bait delivery during the whole study (n = 3 sites of 1 km2 ); b1/b3 = bait delivered monthly during the first phase and trimonthly during the second phase (n = 3); co/b3, no bait delivery during the first and trimonthly delivery during the second phase (n = 3); b1/co, monthly bait delivery during the first and no delivery during the second phase (n = 3); b1/b1, monthly bait delivery during the first and the second phase in a single study plot. This largest study plot comprised initially an area of 6 km2 (gray line) and finally an area of 2 km2 during the second baiting phase.

Main Article

Page created: July 13, 2010
Page updated: July 13, 2010
Page reviewed: July 13, 2010
The conclusions, findings, and opinions expressed by authors contributing to this journal do not necessarily reflect the official position of the U.S. Department of Health and Human Services, the Public Health Service, the Centers for Disease Control and Prevention, or the authors' affiliated institutions. Use of trade names is for identification only and does not imply endorsement by any of the groups named above.
file_external