Skip directly to site content Skip directly to page options Skip directly to A-Z link Skip directly to A-Z link Skip directly to A-Z link
Volume 15, Number 1—January 2009
Research

Enhanced Hygiene Measures and Norovirus Transmission during an Outbreak

Janneke C.M. Heijne1Comments to Author , Peter Teunis1, Gabriella Morroy, Clementine Wijkmans, Sandy Oostveen, Erwin Duizer, Mirjam Kretzschmar, and Jacco Wallinga
Author affiliations: National Institute for Public Health and the Environment, Bilthoven, the Netherlands (J.C.M. Heijne, P. Teunis, E. Duizer, M. Kretzchmar, J. Wallinga); Emory University, Atlanta, Georgia, USA (P. Teunis); Municipal Health Services “Hart voor Brabant,” ‘s-Hertogenbosch, the Netherlands (G. Morroy, C. Wijkmans, S. Oostveen); University Medical Center Utrecht, Utrecht, the Netherlands (M. Kretzschmar, J. Wallinga);

Main Article

Figure 3

Time course of the reproduction number for norovirus at an international scout jamboree, starting July 26, 2004 (day 0), in the Netherlands. Black diamonds show the mean value for the reproduction number over all sampled transmission matrices; vertical lines, mean minimum and maximum values for the reproduction number over all sampled transmission matrices. The dark gray area shows the uncertainty range (0.025 and 0.975 quantiles) in the mean reproduction number; light gray are, the uncertainty

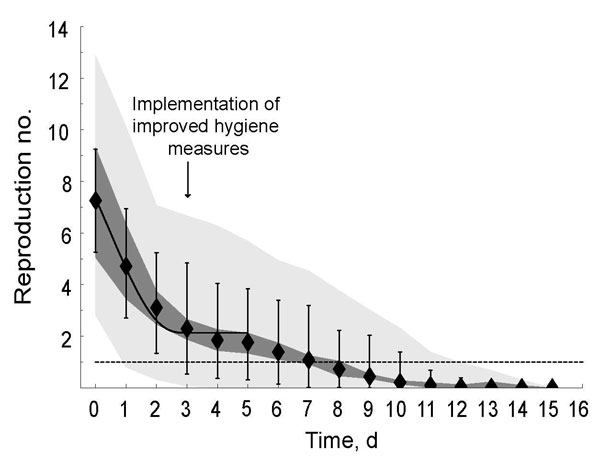
Figure 3. Time course of the reproduction number for norovirus at an international scout jamboree, starting July 26, 2004 (day 0), in the Netherlands. Black diamonds show the mean value for the reproduction number over all sampled transmission matrices; vertical lines, mean minimum and maximum values for the reproduction number over all sampled transmission matrices. The dark gray area shows the uncertainty range (0.025 and 0.975 quantiles) in the mean reproduction number; light gray are, the uncertainty range (0.025 and 0.975 quantiles) of the maximum and minimum estimates of the reproduction number. The solid black line represents the fitted time course of reproduction numbers if decrease in the mean reproduction number results from an instantaneous decline in transmission when enhanced hygiene measures began; dashed line, the threshold value of 1, below which the outbreak was controlled.

Main Article

1These authors contributed equally to this article.

Page created: December 06, 2010
Page updated: December 06, 2010
Page reviewed: December 06, 2010
The conclusions, findings, and opinions expressed by authors contributing to this journal do not necessarily reflect the official position of the U.S. Department of Health and Human Services, the Public Health Service, the Centers for Disease Control and Prevention, or the authors' affiliated institutions. Use of trade names is for identification only and does not imply endorsement by any of the groups named above.
file_external