Skip directly to site content Skip directly to page options Skip directly to A-Z link Skip directly to A-Z link Skip directly to A-Z link
Volume 17, Number 1—January 2011
Research

Endurance, Refuge, and Reemergence of Dengue Virus Type 2, Puerto Rico, 1986–2007

Kate L. McElroy1, Gilberto A. Santiago1, Niall J. Lennon, Bruce W. Birren, Matthew R. Henn1, and Jorge L. Muñoz-Jordán1Comments to Author 
Author affiliations: Author affiliations: Centers for Disease Control and Prevention, San Juan, Puerto Rico (K.L. McElroy, G.A. Santiago, J.L. Muñoz-Jordán); Broad Institute of MIT and Harvard, Cambridge, Massachusetts, USA (N.J. Lennon, B.W. Birren, M.R. Henn)

Main Article

Figure 3

Geographic clustering of Puerto Rico dengue virus lineages. A) Maximum-likelihood phylogeny of clade II. All isolates indicate year of case presentation and GenBank accession numbers. B) Maximum-likelihood phylogeny of subclade IB shows isolates by year and GenBank accession numbers. Six regions had >5 isolates (San Juan, Caguas, Ponce, Mayaguez, Aguadilla, and Arecibo). C) Eight regions of Puerto Rico with colors corresponding to isolates in panel A and year for the 3 regions with more isola

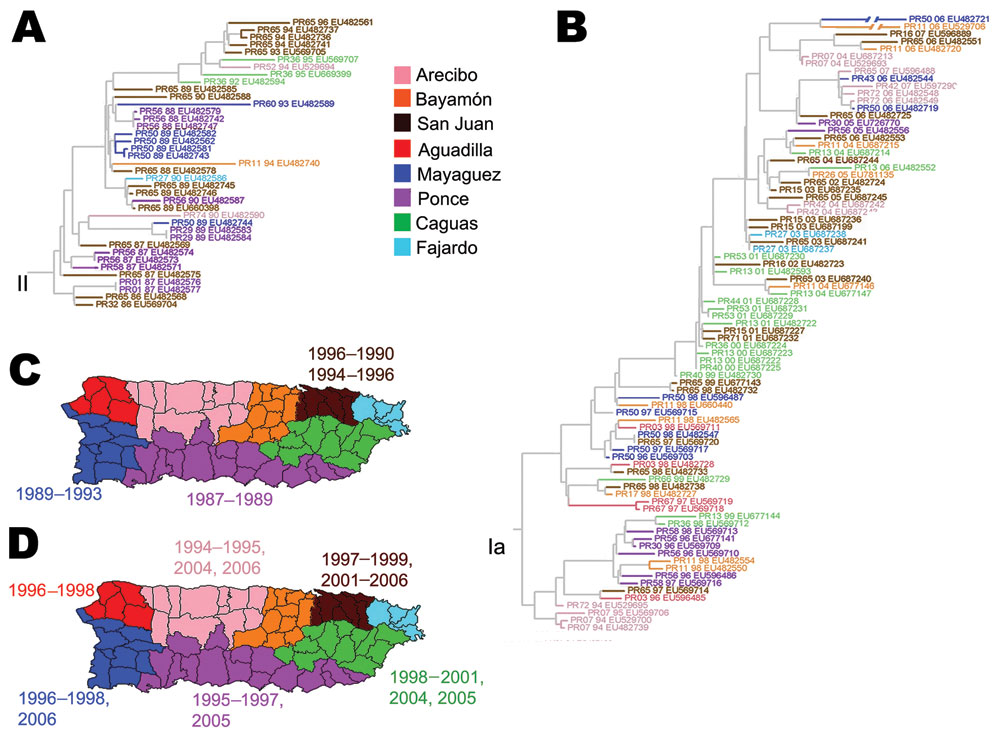
Figure 3. Geographic clustering of Puerto Rico dengue virus lineages. A) Maximum-likelihood phylogeny of clade II. All isolates indicate year of case presentation and GenBank accession numbers. B) Maximum-likelihood phylogeny of subclade IB shows isolates by year and GenBank accession numbers. Six regions had >5 isolates (San Juan, Caguas, Ponce, Mayaguez, Aguadilla, and Arecibo). C) Eight regions of Puerto Rico with colors corresponding to isolates in panel A and year for the 3 regions with more isolates of that clade: San Juan, Mayaguez, and Ponce. D) Eight regions of Puerto Rico, showing colors and years corresponding to isolates in panel B. Correlation between phylogeny and geographic location of isolation for the isolates in this study was estimated by using Bayesian Tip-association Significance testing. Association index 6.51 (95% confidence interval 6.03–7.22); parsimony score statistic 52.27 (95% confidence interval 51–54). Monophyletic clade size Bayesian Tip-association Significance estimates are shown for 6 regions of Puerto Rico with >5 isolates represented in at least 1 subclade and statistically representative geographic associations (p<0.05).

Main Article

1These authors contributed equally to this article.

Page created: July 08, 2011
Page updated: July 08, 2011
Page reviewed: July 08, 2011
The conclusions, findings, and opinions expressed by authors contributing to this journal do not necessarily reflect the official position of the U.S. Department of Health and Human Services, the Public Health Service, the Centers for Disease Control and Prevention, or the authors' affiliated institutions. Use of trade names is for identification only and does not imply endorsement by any of the groups named above.
file_external