Skip directly to site content Skip directly to page options Skip directly to A-Z link Skip directly to A-Z link Skip directly to A-Z link
Volume 18, Number 12—December 2012
Research

Transmission Routes for Nipah Virus from Malaysia and Bangladesh

Bronwyn A. Clayton, Deborah Middleton, Jemma Bergfeld, Jessica Haining, Rachel Arkinstall, Linfa Wang, and Glenn A. MarshComments to Author 
Author affiliations: Author affiliations: Commonwealth Scientific and Industrial Research Organisation Livestock Industries, Geelong, Victoria, Australia (B.A. Clayton, D. Middleton, J. Bergfeld, J. Haining, R. Arkinstall, L. Wang, G.A. Marsh); University of Melbourne, Parkville, Victoria, Australia (B.A. Clayton); Duke–National University of Singapore Graduate Medical School, Singapore (L. Wang)

Main Article

Figure 1

Predicted means for detection of Nipah virus (NiV) RNA in nasal wash samples (A), oral swab samples (B,) and rectal swab samples (C) from experimentally infected ferrets over time, based on residual maximum-likelihood analysis. Black line, NiV-Bangladesh; gray line, NiV-Malaysia. NiV N gene copies per milliliter of sample were calculated from reverse transcription data, then the transformation log10(x1 + 780) was calculated, where x1 = NiV gene copies per milliliter. Values were fitted in the re

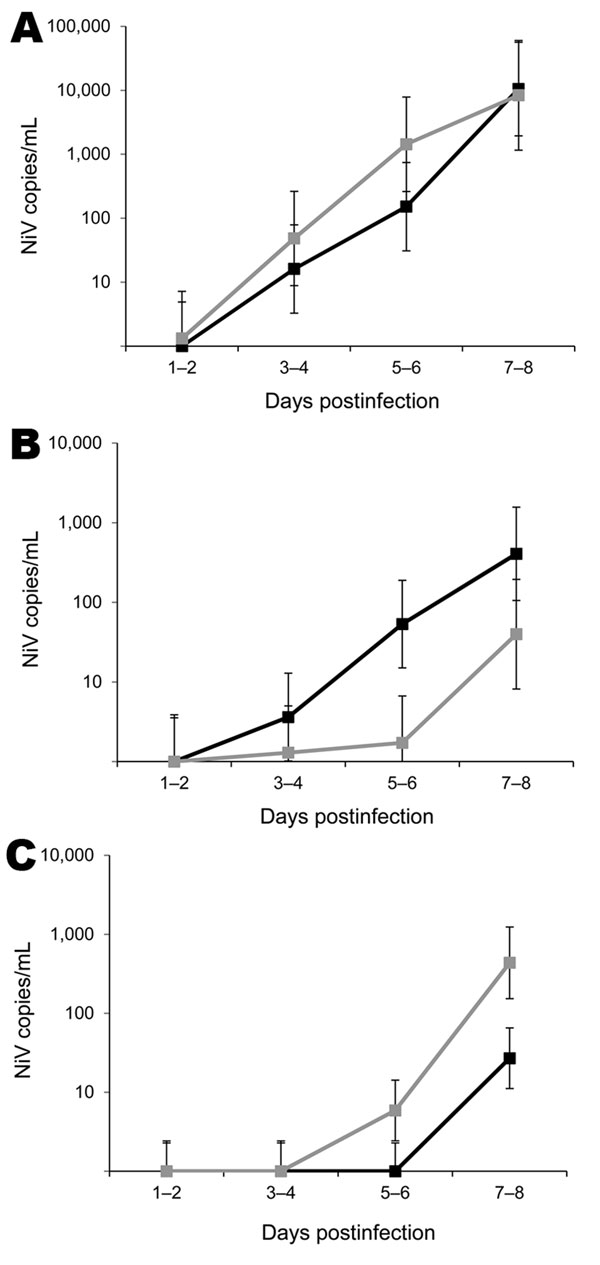
Figure 1. . . Predicted means for detection of Nipah virus (NiV) RNA in nasal wash samples (A), oral swab samples (B,) and rectal swab samples (C) from experimentally infected ferrets over time, based on residual maximum-likelihood analysis. Black line, NiV-Bangladesh; gray line, NiV-Malaysia. NiV N gene copies per milliliter of sample were calculated from reverse transcription data, then the transformation log10(x1 + 780) was calculated, where x1 = NiV gene copies per milliliter. Values were fitted in the residual maximum-likelihood model by using transformed data and are plotted as values relative to the original scale (y-axis; logarithmic scale). Error bars represent approximate upper and lower limits for 95% CIs for the mean (calculated as mean ± 2 SE relative to the transformed scale).

Main Article

Page created: November 20, 2012
Page updated: November 20, 2012
Page reviewed: November 20, 2012
The conclusions, findings, and opinions expressed by authors contributing to this journal do not necessarily reflect the official position of the U.S. Department of Health and Human Services, the Public Health Service, the Centers for Disease Control and Prevention, or the authors' affiliated institutions. Use of trade names is for identification only and does not imply endorsement by any of the groups named above.
file_external