Volume 19, Number 10—October 2013
Dispatch
Evolution of Influenza A Virus H7 and N9 Subtypes, Eastern Asia
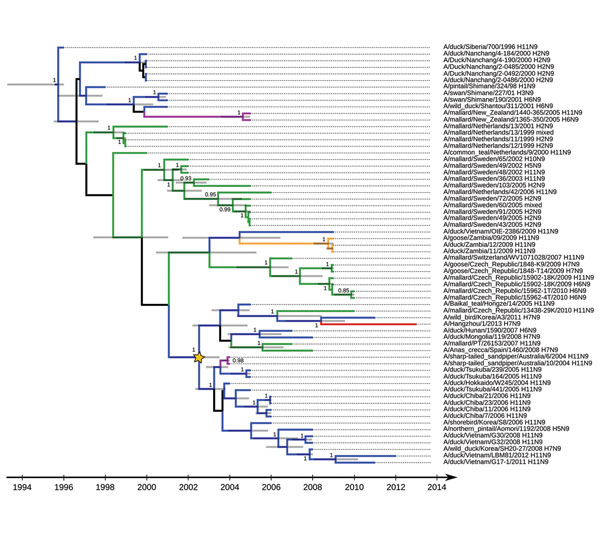
Figure 2

Figure 2. . Maximum clade credibility tree for influenza A virus N9 subtype genetic lineages in Eurasia. Values along branches are posterior probability values >0.8. Gray bars indicate the 95% highest posterior density for times of the most recent common ancestors. Blue indicates viruses isolated in Asia; green indicates viruses isolated in Europe; purple indicates viruses isolated in Oceania; orange indicates viruses isolated in Africa (details on locations and associated posterior probabilities are shown in the online Technical Appendix, wwwnc.cdc.gov/EID/article/19/10/13-0609-Techapp1.pdf); red indicates A/Hangzhou/1/2013(H7N9) virus; and yellow star indicates the basis of influenza A(H11N9) virus genetic lineage from Asia.
Page created: September 16, 2013
Page updated: September 16, 2013
Page reviewed: September 16, 2013
The conclusions, findings, and opinions expressed by authors contributing to this journal do not necessarily reflect the official position of the U.S. Department of Health and Human Services, the Public Health Service, the Centers for Disease Control and Prevention, or the authors' affiliated institutions. Use of trade names is for identification only and does not imply endorsement by any of the groups named above.