Skip directly to site content Skip directly to page options Skip directly to A-Z link Skip directly to A-Z link Skip directly to A-Z link
Volume 19, Number 9—September 2013
Research

Continued Evolution of West Nile Virus, Houston, Texas, USA, 2002–2012

Brian R. Mann1, Allison R. McMullen1, Daniele M. Swetnam, Vence Salvato, Martin Reyna, Hilda Guzman, Rudy Bueno, James A. Dennett, Robert B. Tesh, and Alan D.T. BarrettComments to Author 
Author affiliations: University of Texas Medical Branch, Galveston, Texas, USA (B.R. Mann, A.R. McMullen, D.M. Swetnam, H. Guzman, R.B. Tesh, A.D.T. Barrett); Harris County Public Health and Environmental Services, Houston, Texas, USA (V. Salvato, M. Reyna, R. Bueno, Jr., J.A. Dennett)

Main Article

Figure 3

Evolution of West Nile virus (WNV) in North America, 1999–2012. A) Bayesian coalescent tree of all published North American WNV isolates. The NY99 (NY99) and southwestern (SW/WN03) genotypes flank the North American (NA/WN02) genotype containing inferred monophyletic lineages B–G of the novel 2010–2012 Harris County, Texas, WNV isolates. Red indicates WNV isolates sequenced in this study. Isolates sequenced in this study are indicated in boldface. B) TX8572 2012 Harris County isolate. D) TX8604

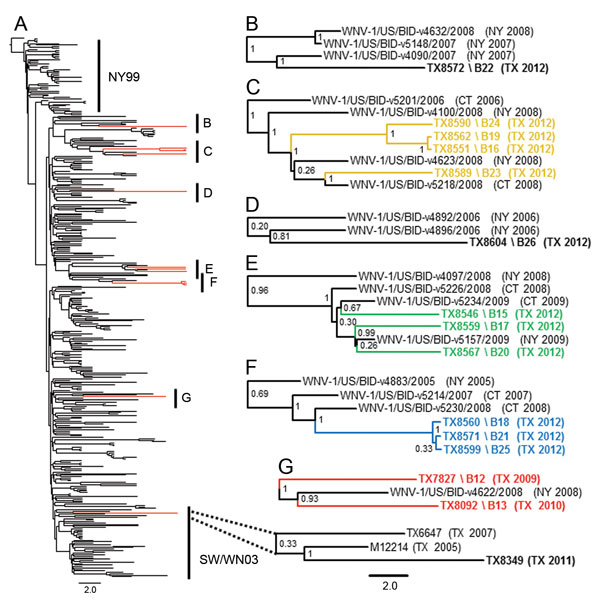
Figure 3. . Evolution of West Nile virus (WNV) in North America, 1999–2012. A) Bayesian coalescent tree of all published North American WNV isolates. The NY99 (NY99) and southwestern (SW/WN03) genotypes flank the North American (NA/WN02) genotype containing inferred monophyletic lineages B–G of the novel 2010–2012 Harris County, Texas, WNV isolates. Red indicates WNV isolates sequenced in this study. Isolates sequenced in this study are indicated in boldface. B) TX8572 2012 Harris County isolate. D) TX8604 2012 Harris County isolate. C and E–G) Proposed monophyletic groups 7–10 described in Figure 1: C) group 10 (yellow); E) group 9 (green); F) group 8 (blue); G) group 7 (red). Dotted lines indicate distribution of the 2011 TX8349 isolate in the SW/WN03 genotype. Posterior probabilities (range 0.00–1.00) are indicated along branches to provide statistical support for inferred topologies. Scale bars indicate divergence time in years.

Main Article

1These authors contributed equally to this article.

Page created: August 20, 2013
Page updated: August 20, 2013
Page reviewed: August 20, 2013
The conclusions, findings, and opinions expressed by authors contributing to this journal do not necessarily reflect the official position of the U.S. Department of Health and Human Services, the Public Health Service, the Centers for Disease Control and Prevention, or the authors' affiliated institutions. Use of trade names is for identification only and does not imply endorsement by any of the groups named above.
file_external