Molecular Epidemiology of Influenza A(H1N1)pdm09 Virus among Humans and Swine, Sri Lanka
Harsha K.K. Perera, Dhanasekaran Vijaykrishna, Akuratiya G. Premarathna, Chrishan J.S. Jayamaha, Geethani Wickramasinghe, Chung L. Cheung, Ming F. Yeung, Leo L.M. Poon, Aluthgama K.C. Perera, Ian Barr, Yi Guan, and Ahmad M. Hakawi

Author affiliations: University of Hong Kong, Hong Kong, China (H.K.K. Perera, C.L. Cheung, M.F. Yeung. L.L.M. Poon, Y. Guan, M. Peiris); University of Kelaniya, Kelaniya, Sri Lanka (H.K.K. Perera, A.G. Premarathna); Duke-National University of Singapore Graduate Medical School, Singapore (D. Vijaykrishna); Medical Research Institute, Colombo, Sri Lanka (C.J.S. Jayamaha, G. Wickramasinghe); Colombo Municipal Council, Colombo (A.K.-C. Perera); WHO Collaborating Centre for Reference and Research on Influenza, Melbourne, Australia (I.G.Barr)
Main Article
Figure 1
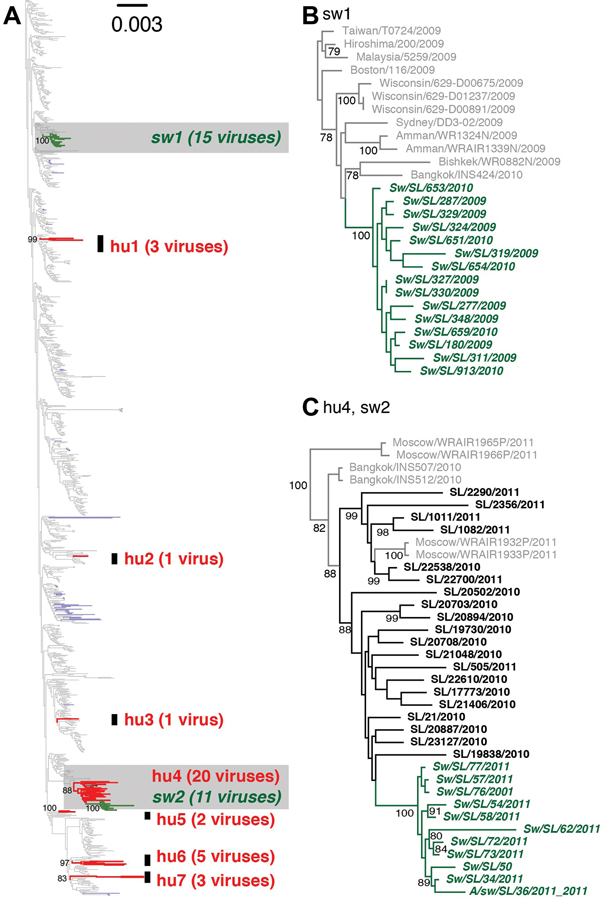
Figure 1.
Phylogenetic relationships of influenza A H1N1pdm viruses isolated from human and swine during 2009–2012 in Sri Lanka. (A) Maximum likelihood tree generated from a concatenated dataset of 8 gene segment sequences from 1,057 human and 82 swine H1N1pdm viruses isolated globally during 2009–2012, and 35 human and 26 swine H1N1pdm viruses isolated in Sri Lanka in 2009–2012. Red and green branches represent human (hu) and swine (sw) viruses isolated in Sri Lanka, respectively; gray and blue branches represent globally sampled human and swine viruses, respectively. Highlighted regions (gray) are shown with virus names in (B) and (C), respectively. Support values estimated from 500 maximum likelihood bootstrap replicates are shown along the node for each swine and human clusters identified in Sri Lanka in (A) and for each node with >70% support for (B) and (C).
Main Article
Page created: November 19, 2014
Page updated: November 19, 2014
Page reviewed: November 19, 2014
The conclusions, findings, and opinions expressed by authors contributing to this journal do not necessarily reflect the official position of the U.S. Department of Health and Human Services, the Public Health Service, the Centers for Disease Control and Prevention, or the authors' affiliated institutions. Use of trade names is for identification only and does not imply endorsement by any of the groups named above.