Skip directly to site content Skip directly to page options Skip directly to A-Z link Skip directly to A-Z link Skip directly to A-Z link
Volume 21, Number 10—October 2015
Research

Effect of Live Poultry Market Closure on Avian Influenza A(H7N9) Virus Activity in Guangzhou, China, 2014

Jun Yuan1, Eric H.Y. Lau1, Kuibiao Li1, Y.H. Connie Leung1, Zhicong Yang1, Caojun Xie1, Yufei Liu1, Yanhui Liu, Xiaowei Ma, Jianping Liu, Xiaoquan Li, Kuncai Chen, Lei Luo, Biao Di, Benjamin J. Cowling, Xiaoping TangComments to Author , Gabriel M. Leung, Ming Wang2Comments to Author , and Malik Peiris2
Author affiliations: Guangzhou Center for Disease Control and Prevention, Guangzhou, China (J. Yuan, K. Li, Z. Yang, C. Xie, Yufei Liu, Yanhui Liu, X. Ma, J. Liu, X. Li, K. Chen, L. Luo, B. Di, M. Wang); The University of Hong Kong, Hong Kong, China (E.H.Y. Lau, Y.H.C. Leung, B.J. Cowling, G.M. Leung, M. Peiris); The Eighth People’s Hospital of Guangzhou, Guangzhou, China (X. Tang)

Main Article

Figure 3

Avian influenza virus (AIV) activity in wholesale, retail, and dressed poultry markets under enhanced surveillance in Guangzhou, China, 2014. A) AIV and B) influenza A(H7N9) virus detection rates as determined by real-time reverse transcription PCR (rRT-PCR). Circles at the top of panel B indicate H7N9 virus–positive (solid) and –negative (open) samples isolated by culture from the different types of poultry markets. Some H7N9 virus samples positive by rRT-PCR did not have sufficient sample rema

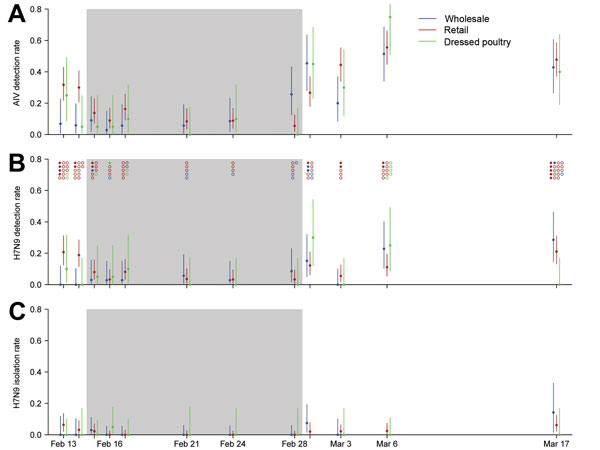
Figure 3. Avian influenza virus (AIV) activity in wholesale, retail, and dressed poultry markets under enhanced surveillance in Guangzhou, China, 2014. A) AIV and B) influenza A(H7N9) virus detection rates as determined by real-time reverse transcription PCR (rRT-PCR). Circles at the top of panel B indicate H7N9 virus–positive (solid) and –negative (open) samples isolated by culture from the different types of poultry markets. Some H7N9 virus samples positive by rRT-PCR did not have sufficient sample remaining for virus culture; the numbers of samples cultured and positive at each time point are shown. C) H7N9 virus isolation rates as determined by culture. Rates for positive cultures were estimated on the basis of the samples available for culture, as described in Materials and Methods. Vertical bars indicate 95% CIs for detection rates and 95% credible intervals for isolation rates. Gray shading indicates the 2-week citywide market closure, which began on February 15, 2014.

Main Article

1These first authors contributed equally to this article.

2These senior authors contributed equally to this article.

Page created: September 22, 2015
Page updated: September 22, 2015
Page reviewed: September 22, 2015
The conclusions, findings, and opinions expressed by authors contributing to this journal do not necessarily reflect the official position of the U.S. Department of Health and Human Services, the Public Health Service, the Centers for Disease Control and Prevention, or the authors' affiliated institutions. Use of trade names is for identification only and does not imply endorsement by any of the groups named above.
file_external