Genetic Characterization of Highly Pathogenic Avian Influenza A(H5N6) Virus, Guangdong, China
Chris Ka Pun Mok
1, Wen Da Guan
1, Xiao Qing Liu
1, Mart Matthias Lamers
1, Xiao Bo Li, Ming Wang, Tami Jing Shu Zhang, Qing Ling Zhang, Zheng Tu Li, Ji Cheng Huang, Jin Yan Lin, Yong Hui Zhang, Ping Zhao, Horace Hok Yeung Lee, Ling Chen, Yi Min Li, Joseph Sriyal Malik Peiris, Rong Chang Chen, Nan Shan Zhong, and Zi Feng Yang

Author affiliations: The University of Hong Kong,HKU–Pasteur Research Pole, Hong Kong, China (C.K.P Mok, M.M. Lamers, T.J.S. Zhang, H.H.Y. Lee, J.S.M. Peiris); State Key Laboratory of Respiratory Disease, Guangzhou, China (W.D. Guan, X.Q. Liu, Q.L. Zhang, Z.T. Li, L. Chen, Y.M. Li, R.C. Chen, N.S. Zhong, Z.F. Yang); Guangdong Inspection and Quarantine Technology Center, Guangzhou (X.B. Li, J.C. Huang); Guangdong Center for Disease Control and Prevention, Guangzhou (J.Y. Lin, Y.H. Zhang); Guangzhou Center for Disease Control and Prevention, Guangzhou (M. Wang); Guangzhou Clifford Hospital, Guangzhou (P. Zhao)
Main Article
Figure
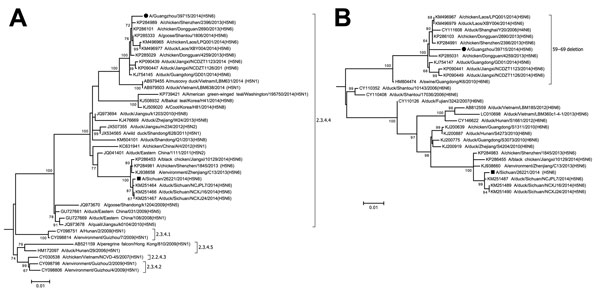
Figure. Phylogenetic trees of influenza A(H5N6) virus isolate A/Guangzhou/39715/2014 compared with other influenza viruses based on the A) hemagglutinin (HA) and B) neuraminidase (NA) genes, China. Maximum-likelihood trees were constructed by using the the general time reversible plus gamma distribution plus invariant sites (GTR+G+I) model in MEGA 6.06 (http://www.megasoftware.net). Bootstrap values were calculated on 1,000 replicates; only values >60% are shown. A/Guangzhou/39715/2014 and A/Sichuan/26221/2014 are indicated by a circle and a square, respectively. Brackets denote H5 subtype virus clades. Scale bars indicate nucleotide substitutions per site. Full HA and NA trees are provided in the Technical Appendix
Main Article
Page created: November 17, 2015
Page updated: November 17, 2015
Page reviewed: November 17, 2015
The conclusions, findings, and opinions expressed by authors contributing to this journal do not necessarily reflect the official position of the U.S. Department of Health and Human Services, the Public Health Service, the Centers for Disease Control and Prevention, or the authors' affiliated institutions. Use of trade names is for identification only and does not imply endorsement by any of the groups named above.