Volume 21, Number 4—April 2015
Research
Norovirus Genotype Profiles Associated with Foodborne Transmission, 1999–2012
Linda Verhoef1 , Joanne Hewitt1, Leslie Barclay1, Sharia Ahmed, Rob Lake, Aron J. Hall, Ben Lopman, Annelies Kroneman, Harry Vennema, Jan VinjA(c), and Marion Koopmans
Figure 3
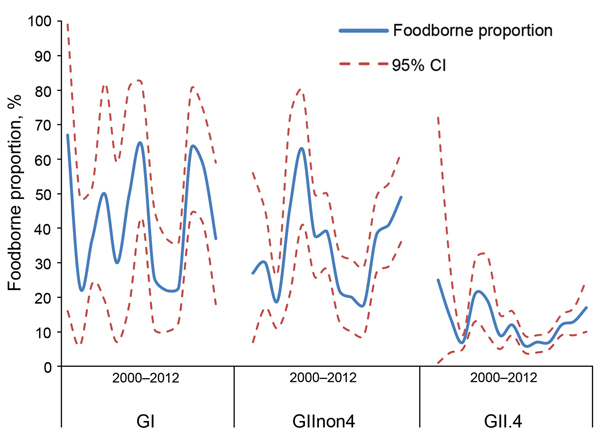
Figure 3. Genotype profiles. Foodborne proportion per genotype group per year, as reported to Foodborne Viruses in Europe/Noronet, with polymerase genotypes (n = 4,580) or, if missing, capsid genotypes (n = 1,003).
1These authors contributed equally to this article.
Page created: March 11, 2015
Page updated: March 11, 2015
Page reviewed: March 11, 2015
The conclusions, findings, and opinions expressed by authors contributing to this journal do not necessarily reflect the official position of the U.S. Department of Health and Human Services, the Public Health Service, the Centers for Disease Control and Prevention, or the authors' affiliated institutions. Use of trade names is for identification only and does not imply endorsement by any of the groups named above.