Skip directly to site content Skip directly to page options Skip directly to A-Z link Skip directly to A-Z link Skip directly to A-Z link
Volume 21, Number 6—June 2015
Dispatch

KPC and NDM-1 Genes in Related Enterobacteriaceae Strains and Plasmids from Pakistan and the United States

Mitchell W. Pesesky1, Tahir Hussain1, Meghan Wallace, Bin Wang, Saadia Andleeb, Carey-Ann D. Burnham, and Gautam DantasComments to Author 
Author affiliations: Washington University School of Medicine in St. Louis, St. Louis, Missouri, USA (M.W. Pesesky, T. Hussain. M. Wallace, B. Wang, C.D. Burnham, G. Dantas); National University of Sciences and Technology, Islamabad, Pakistan (T. Hussain, S. Andleeb)

Main Article

Figure 2

Pairwise BLAST identity (http://blast.ncbi.nlm.nih.gov/Blast.cgi) of all CTX-M genes, Klebsiella pneumoniae carbapenemase (KPC), and New Delhi metallo-β-Lacatamase-1 (NDM-1) plasmids from isolates collected in Pakistan and the United States plasmid preparations, and the National Center for Biotechnology Information database complete plasmids. An all-against-all plasmid BLAST was performed and plasmid interactions were defined by the percentage of the query plasmid conserved (at ≥99% identity) in

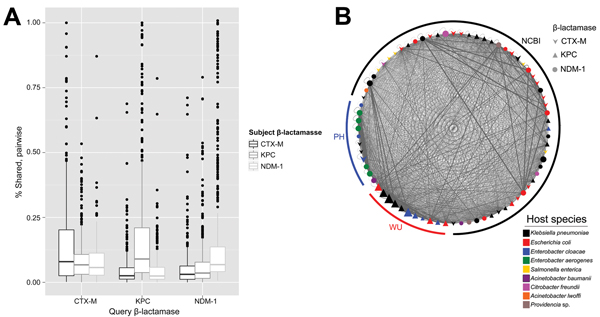
Figure 2. Pairwise BLAST identity (http://blast.ncbi.nlm.nih.gov/Blast.cgi) of all CTX-M genes, Klebsiella pneumoniae carbapenemase (KPC), and New Delhi metallo-β-Lacatamase-1 (NDM-1) plasmids from isolates collected in Pakistan and the United States plasmid preparations, and the National Center for Biotechnology Information database complete plasmids. An all-against-all plasmid BLAST was performed and plasmid interactions were defined by the percentage of the query plasmid conserved (at ≥99% identity) in the subject plasmid. A) Plasmid interactions collected based on the defining β-lactamase of their query and subject plasmids. Box and whisker plots represent the range of pairwise sharing values within this population of plasmids. Upper and lower boundaries of the box correspond to the first and thirds quartiles; whiskers (error bars) represent 1.5 times the interquartile range; points beyond the whiskers represent outliers. B) Network map in which nodes represent individual plasmids and lines represent regions shared between plasmids. Line width is proportional to the number of nucleotides contained in fragments >500 bp in length at >99% sequence identity. Genetic elements repeated within the same plasmid DNA are represented by lines that leave and return to the same node. Plasmid sequence origin is indicated in arcs around the network.

Main Article

1These first authors contributed equally to this article.

Page created: May 15, 2015
Page updated: May 15, 2015
Page reviewed: May 15, 2015
The conclusions, findings, and opinions expressed by authors contributing to this journal do not necessarily reflect the official position of the U.S. Department of Health and Human Services, the Public Health Service, the Centers for Disease Control and Prevention, or the authors' affiliated institutions. Use of trade names is for identification only and does not imply endorsement by any of the groups named above.
file_external