Skip directly to site content Skip directly to page options Skip directly to A-Z link Skip directly to A-Z link Skip directly to A-Z link
Volume 21, Number 7—July 2015
Research

Transdermal Diagnosis of Malaria Using Vapor Nanobubbles

Ekaterina Lukianova-Hleb, Sarah Bezek, Reka Szigeti, Alexander Khodarev, Thomas Kelley, Andrew Hurrell, Michail Berba, Nirbhay Kumar, Umberto D’Alessandro, and Dmitri LapotkoComments to Author 
Author affiliations: Rice University, Houston, Texas, USA (E. Lukianova-Hleb, D. Lapotko); Baylor College of Medicine, Houston (S. Bezek, R. Szigeti); Ben Taub General Hospital, Houston (S. Bezek, R. Szigeti); X Instruments LLC, Fremont, California, USA (A. Khodarev); Precision Acoustics Ltd, Dorset, UK (T. Kelley, A. Hurrell); Standa UAB, Vilnius, Lithuania (M. Berba); Tulane University, New Orleans, Louisiana, USA (N. Kumar); Medical Research Council, Banjul, The Gambia (U. D’Alessandro); London School of Hygiene and Tropical Medicine, London, UK (U. D’Alessandro)

Main Article

Figure 2

A) Acoustic traces obtained in vitro in response to a single laser pulse exposure (532 nm, 36 mJ/cm2 delivered at 0 time point) from the sample of whole human blood (black) and for the same blood sample after the addition of hemozoin in the concentration corresponding to the parasitemia level of 0.8% (red). y-axis shows the output signal of the acoustic sensor, Inset: optical scattering time-responses obtained for these 2 samples show the transient bulk heating of the blood (black) and the gener

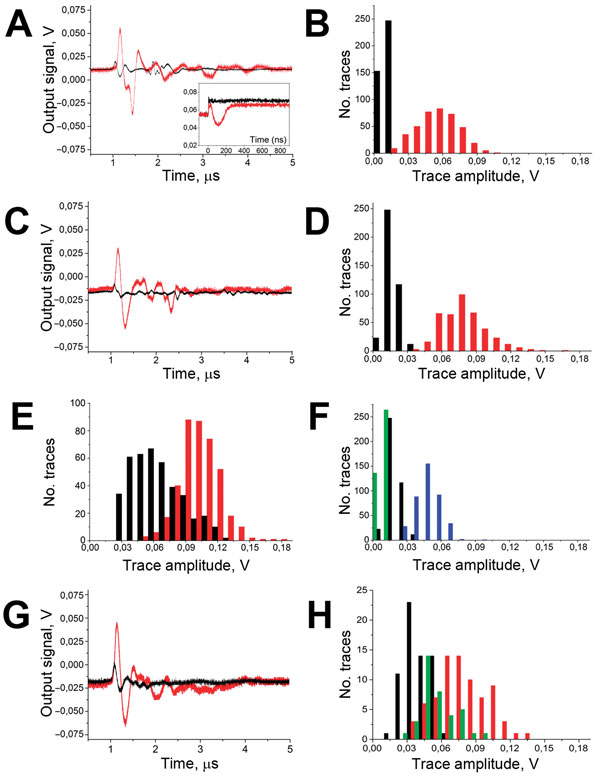
Figure 2. A) Acoustic traces obtained in vitro in response to a single laser pulse exposure (532 nm, 36 mJ/cm2 delivered at 0 time point) from the sample of whole human blood (black) and for the same blood sample after the addition of hemozoin in the concentration corresponding to the parasitemia level of 0.8% (red). y-axis shows the output signal of the acoustic sensor, Inset: optical scattering time-responses obtained for these 2 samples show the transient bulk heating of the blood (black) and the generation of transient vapor nanobubble (red). B) Histograms of the trace amplitudes for 400 traces obtained under identical conditions for the above 2 samples. y-axis indicates number of traces with the amplitude in the specific range. C) Acoustic traces obtained from the wrist veins of an uninfected volunteer with light dark skin (black) and from a malaria-diagnosed patient with light dark skin (red). D) Histograms of the acoustic trace amplitudes obtained from the wrist veins of an uninfected volunteer with light dark skin (black) and for a malaria-diagnosed patient with similar light dark skin (red). E) Histograms of the acoustic trace amplitudes obtained from the earlobes of an uninfected volunteer (black) and for a malaria-diagnosed patient (red). F) Histograms of the acoustic trace amplitudes obtained for healthy volunteers with different skin darkness: green, pale light skin; black, light dark skin; blue, dark skin. G) Acoustic traces obtained transcuticle from individual mosquitoes: fed with uninfected blood and oocyst negative (black) and fed with malaria-infected blood and oocyst positive (red). H) Histograms of the acoustic trace amplitudes obtained from oocyst-negative (black) and oocyst-positive (red) mosquitoes and mosquitoes fed with uninfected blood mixed with hemozoin at 60 μg/mL (green).

Main Article

Page created: June 12, 2015
Page updated: June 12, 2015
Page reviewed: June 12, 2015
The conclusions, findings, and opinions expressed by authors contributing to this journal do not necessarily reflect the official position of the U.S. Department of Health and Human Services, the Public Health Service, the Centers for Disease Control and Prevention, or the authors' affiliated institutions. Use of trade names is for identification only and does not imply endorsement by any of the groups named above.
file_external