Volume 21, Number 9—September 2015
Dispatch
Randomness of Dengue Outbreaks on the Equator
Abstract
A simple mathematical model without seasonality indicated that the apparently chaotic dengue epidemics in Singapore have characteristics similar to epidemics resulting from chance. Randomness as a sufficient condition for patterns of dengue epidemics in equatorial regions calls into question existing explanations for dengue outbreaks there.
Dengue, a vectorborne infectious disease, has complex epidemiologic dynamics (1). The recent expansion of the range of dengue makes this disease a considerable public health concern worldwide (2). In the city-state of Singapore, the number of dengue cases has increased dramatically since the 1990s, and all 4 serotypes of the dengue virus are endemic (3). Cyclical outbreaks of dengue of increasing magnitude have been observed with a cycle of 5–6 years (4), but this pattern appeared to cease in 2005, and no obvious cycle has occurred since then. Although other tropical and subtropical countries in Southeast Asia have distinct seasonality (5) so that dengue epidemics occur at distinct and predictable times of the year (6), Singapore’s proximity to the equator gives it an aseasonal climate, and the timing of dengue epidemics is irregular (7,8).
Many factors have been postulated to contribute to dengue’s spread in Singapore, such as a consistently warm and humid climate that favors year-round vector proliferation, high urbanization, and a tendency for vectors to live in human residences (9). The extent to which these factors affect dengue epidemics in aseasonal Singapore, if they do at all, is unclear. Competing explanations for the timing of large dengue outbreaks in Singapore can be found in the literature. One study attributes dengue epidemics to conducive temperatures and precipitation variations (10); another attributes them to variable maximum and minimum temperatures (11). Rainfall and temperature have been shown to be related to dengue outbreaks in Brazil, another equatorial country (12).
The tendency to see patterns where none exists has been well recognized. When 2 events happen contemporarily and a plausible story connects the events, the tendency to assume that 1 causes the other is strong (13). Cancer cases cluster around mobile phone masts (base stations), not because the radiation from a mast is carcinogenic at typical exposures but because numerous masts exist and occasionally cancer cases cluster together, similarly to spilled grains of rice (14). A study in the heuristics and biases program discusses a famous example from sports (15), which are notorious for stories being concocted around essentially chance outcomes. Basketball fans, coaches, and pundits often believe that players have “hot hand” streaks when they have a run of good form, making many shots in succession and playing above their usual level during a match. The study systematically deconstructed this belief by a series of statistical tests that showed that the patterns of actual hits and misses was consistent with mere chance—analogous to sequences of coin tosses rather than an illusory hot hand (15).
In probabilistic models, chance is represented by error terms, or noise, encompassing all the many complicating factors that are not worth including in the systematic signal. Past models for dengue in Singapore have accounted for chance alongside systematic effects of the weather and other factors (10,11). However, is chance alone sufficient to explain the frequent, large, and ostensibly chaotic outbreaks we observe? We sought to assess whether the rise and fall of dengue outbreaks from week to week in Singapore come in runs or are indistinguishable from random noise and thereby whether it is necessary to consider other possible drivers of these epidemics.
We reviewed data on the weekly incidence of clinically diagnosed dengue in Singapore during 2003–2012. We compared the number of dengue cases per week to a simple simulation model (Technical Appendix) with no environmental drivers other than the dependence of weekly number of cases from up to 4 weeks before. Summaries of observed incidence and of the simulated aseasonal model were compared for assessing proximity of the behavior of observed cases to the behavior of simulated cases.
Figure 1
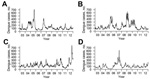
Figure 1. Weekly trends for observed and simulated dengue incidence, 2003–2012, Singapore. A) Weekly trends for the actual scenario of observed dengue incidence. B–D) Three randomly generated simulated scenarios from the aseasonal model...
The simulation model used was a standard autoregressive time series model in which the number of cases during any week affects the mean number of cases for the 4 weeks that follow. We allowed the simulated number to have a random variation around that mean; data were log-transformed to ensure that incidence was positive. The fitted autoregressive model was used to simulate synthetic dengue outbreaks over multiple decades, and incidence of simulated outbreaks was compared with observed incidence. We devised a series of statistical measures that were inspired by the “hot hand” in basketball study (15) and that might falsify the model that accounted for chance alone. This model included correlation between dengue incidence by week and the preceding week (the autocorrelation function), the probability distribution for the weekly incidence aggregated over 10 years, the distribution of the annual number of cases, the maximum number of cases observed over the previous decade, and the probability of a rise in incidence each week following a series of rises (i.e., the possible beginning of an epidemic) or a series of declines (i.e., the possible ending of an epidemic). We also created simulated trajectories (Figure 1).
Figure 2
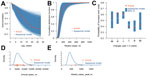
Figure 2. Comparison of observed dengue incidence and incidence from simulated aseasonal models, 2003–2012, Singapore. A) Distribution of actual and simulated autocorrelation functions at different time lags (e.g., this week versus next week;...
For all metrics considered, the actual scenario (i.e., the observed dengue incidence) was fully consistent with the aseasonal model; both the autocorrelation function (Figure 2, panel A) and the cumulative probability of dengue incidence (Figure 2, panel B) from the historical incidence data lie within the distribution resulting from the aseasonal model. The probabilities of an increase in incidence each week that follows a series of rises or falls and corresponding 95% CIs calculated on the basis of simulations from the aseasonal model all include the proportions observed historically (Figure 2, panel C). Furthermore, the distribution of the annual incidence (Figure 2, panel D) and the maximum observed incidence over the decade (Figure 2, panel E) are consistent with the aseasonal model. Similarly, the number of successive increases or decreases over the decade was consistent with chance (p = 0.18).
These metrics are not conventional measures of dengue surveillance data; they capture more complex, emergent properties of the epidemic process. However, our findings show that, for dengue incidence in equatorial Singapore, where average monthly temperatures vary only from 26°C–28°C, randomness alone is sufficient to explain the apparent epidemics of dengue. Although seasonal factors may have a role, as the literature suggests (10,11), seasonality or other temporal drivers such as fluctuation in the intensity of the country’s vector control program are not necessary to explain the qualitative and quantitative patterns of dengue in this equatorial city-state. As our results suggest, the possibility that dengue outbreaks occur in aseasonal locations because of chance should be considered.
Ms. Chen is a research assistant and doctoral student at the National University of Singapore. Her main research interest is modelling of endemic diseases such as dengue and hand, foot and mouth disease.
Acknowledgments
This study was funded by the Center for Infectious Disease Epidemiology and Research in the Saw Swee Hock School of Public Health, and additional funding was provided by Singapore's Health Services Research grant number HSRG-0040-2013.
Data used in this paper are available at http://www.moh.gov.sg.
References
- Cummings DA, Irizarry RA, Huang NE, Endy TP, Nisalak A, Ungchusak K, Travelling waves in the occurrence of dengue haemorrhagic fever in Thailand. Nature. 2004;427:344–7. DOIPubMedGoogle Scholar
- Bhatt S, Gething PW, Brady OJ, Messina JP, Farlow AW, Moyes CL, The global distribution and burden of dengue. Nature. 2013;496:504–7. DOIPubMedGoogle Scholar
- World Health Organization. Dengue and severe dengue. 2014 Mar [cited 2015 Apr 1]. http://www.who.int/mediacentre/factsheets/fs117/en/index.html
- Ooi EE, Goh KT, Gubler DJ. Dengue prevention and 35 years of vector control in Singapore. Emerg Infect Dis. 2006;12:887–93. DOIPubMedGoogle Scholar
- Wongkoon S, Jaroensutasinee M, Jaroensutasinee K. Distribution, seasonal variation & dengue transmission prediction in Sisaket, Thailand. Indian J Med Res. 2013;138:347–53.PubMedGoogle Scholar
- Bhatia R, Dash AP, Sunyoto T. Changing epidemiology of dengue in South-East Asia. World Health Organ South East Asia J Public Health. 2013;2:23–7. DOIGoogle Scholar
- Ministry of Health Singapore. Communicable diseases surveillance in Singapore 2011. 2012 [updated 2013 Jul 26] [cited 2014 Jan 17]. http://www.moh.gov.sg/content/moh_web/home/Publications/Reports/2012/_communicable_diseasessurveillanceinsingapore2011.html
- Ministry of Health Singapore. Communicable diseases surveillance in Singapore 2012. 2013 [updated 2014 Jan 22] [cited 2014 Jan 17]. http://www.moh.gov.sg/content/moh_web/home/Publications/Reports/2013/Communicable_Diseases_Surveillance_in_Singapore_2012.html
- Gubler DJ. Dengue, urbanization and globalization: the unholy trinity of the 21(st) century. Trop Med Health. 2011;39(Suppl):S3–11. DOIPubMedGoogle Scholar
- Hii YL, Rocklöv J, Nawi N, Tang CS, Pang FY, Sauerborn R. Climate variability and increase in intensity and magnitude of dengue incidence in Singapore. Glob Health Action. 2009;2.PubMedGoogle Scholar
- Pinto E, Coelho M, Oliver L, Massad E. The influence of climate variables on dengue in Singapore. Int J Environ Health Res. 2011;21:415–26. DOIPubMedGoogle Scholar
- Horta MA, Bruniera R, Ker F, Catita C, Ferreira AP. Temporal relationship between environmental factors and the occurrence of dengue fever. Int J Environ Health Res. 2014;24:471–81. DOIPubMedGoogle Scholar
- Fung K. Numbers rule your world: the hidden influence of probabilities and statistics on everything you do. New York: McGraw Hill; 2010.
- Blastland M, Dilnot A. The numbers game: the commonsense guide to understanding numbers in the news, in politics, and in life. New York: Gotham; 2010.
- Gilovich T, Vallone R, Tversky A. The hot hand in basketball: on the misperception of random sequences. Cogn Psychol. 1985;17:295–314. DOIGoogle Scholar
Figures
Cite This ArticleTable of Contents – Volume 21, Number 9—September 2015
| EID Search Options |
|---|
|
|
|
|
|
|
Please use the form below to submit correspondence to the authors or contact them at the following address:
Alex R. Cook, Saw Swee Hock School of Public Health, Tahir Foundation Building, National University of Singapore, 12 Science Drive 2, Singapore 117549
Top