Skip directly to site content Skip directly to page options Skip directly to A-Z link Skip directly to A-Z link Skip directly to A-Z link
Volume 22, Number 12—December 2016
Research

African Horse Sickness Caused by Genome Reassortment and Reversion to Virulence of Live, Attenuated Vaccine Viruses, South Africa, 2004–2014

Camilla Weyer, John D. Grewar, Phillippa Burger, Esthea Rossouw, Carina Lourens, Christopher Joone, Misha le Grange, Peter Coetzee, Estelle H. Venter, Darren P. Martin, N. James MacLachlan, and Alan J. GuthrieComments to Author 
Author affiliations: University of Pretoria, Onderstepoort, South Africa (C.T. Weyer, P. Burger, C. Lourens, C. Joone, M. le Grange, P. Coetzee, E. Venter, N.J. MacLachlan, A.J. Guthrie); Western Cape Department of Agriculture, Elsenburg, South Africa (J.D. Grewar); Wits Health Consortium, Johannesburg, South Africa (E. Rossouw); University of Cape Town, Cape Town, South Africa (D.P. Martin); University of California, Davis, CA, USA (N.J. MacLachlan)

Main Article

Figure 4

Statistical evidence of reassortment within the genomes of African horse sickness (AHS) virus field isolates identified in outbreaks in the AHS controlled area in Western Cape Province, South Africa, 2004–2014. A hidden Markov model–based approach (BURT-HMM) was used to classify individual nucleotides within each of the 10 segments of individual AHS virus isolates into 3 different categories: 1/Lab/ZAF/98/OBP-116-like (green), 3/Lab/ZAF/98/OBP-116-like (blue), and 4/Lab/ZAF/98/OBP-116-like (red)

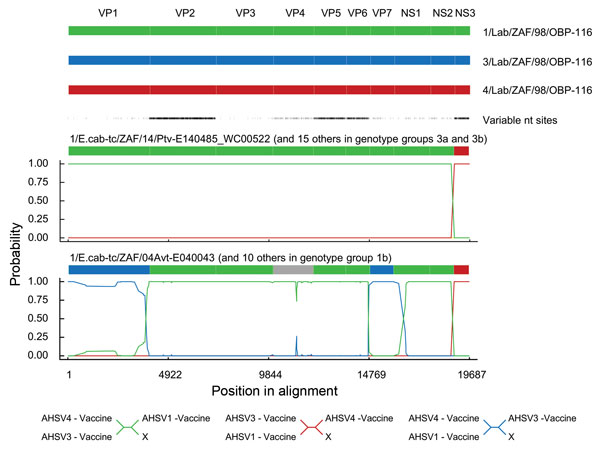
Figure 4. Statistical evidence of reassortment within the genomes of African horse sickness (AHS) virus field isolates identified in outbreaks in the AHS controlled area in Western Cape Province, South Africa, 2004–2014. A hidden Markov model–based approach (BURT-HMM) was used to classify individual nucleotides within each of the 10 segments of individual AHS virus isolates into 3 different categories: 1/Lab/ZAF/98/OBP-116-like (green), 3/Lab/ZAF/98/OBP-116-like (blue), and 4/Lab/ZAF/98/OBP-116-like (red). Probability supports for these classifications yielded by the BURT-HMM with the highest likelihood are plotted along the genome. Positions of segment boundaries are given in the diagram above the plots. The phylogenetic clusterings that are implied by differently colored segments in these plots are indicated below the plots. The segment indicated in gray could not be convincingly classified because it closely resembles both 1/Lab/ZAF/98/OBP-116 and 3/Lab/ZAF/98/OBP-116.

Main Article

Page created: November 17, 2016
Page updated: November 17, 2016
Page reviewed: November 17, 2016
The conclusions, findings, and opinions expressed by authors contributing to this journal do not necessarily reflect the official position of the U.S. Department of Health and Human Services, the Public Health Service, the Centers for Disease Control and Prevention, or the authors' affiliated institutions. Use of trade names is for identification only and does not imply endorsement by any of the groups named above.
file_external