Skip directly to site content Skip directly to page options Skip directly to A-Z link Skip directly to A-Z link Skip directly to A-Z link
Volume 22, Number 12—December 2016
Letter

Dual Emergence of Usutu Virus in Common Blackbirds, Eastern France, 2015

Sylvie LecollinetComments to Author , Yannick Blanchard, Christine Manson, Steeve Lowenski, Eve Laloy, Hélène Quenault, Fabrice Touzain, Pierrick Lucas, Cyril Eraud, Céline Bahuon, Stéphan Zientara, Cécile Beck, and Anouk Decors
Author affiliations: NSES Animal Health Laboratory of Maisons-Alfort, Maisons-Alfort, France (S. Lecollinet, S. Lowenski, C. Bahuon, S. Zientara, C. Beck); ANSES Ploufragan, Ploufragan, France (Y. Blanchard, H. Quenault, F. Touzain, P. Lucas); Departmental Veterinary Laboratory of Haut-Rhin (LVD68), Colmar, France (C. Manson); ENVA, Maisons-Alfort (E. Laloy); ONCFS, Paris, France (C. Eraud, A. Decors)

Main Article

Figure

Phylogeny of Usutu virus (USUV) Haut-Rhin strains (black circles) and Rhône strain (black triangle), isolated in 2015 in eastern France compared with reference strains. Inset map shows locations where isolates were obtained. The strains from France are genetically distinct, with a homology of 95.7% at the nucleotide level and 98.8% (3,392–3 aa/3,434 aa) at the amino acid level. The evolutionary history was inferred by using the neighbor-joining method. The optimal tree with the sum of branch len

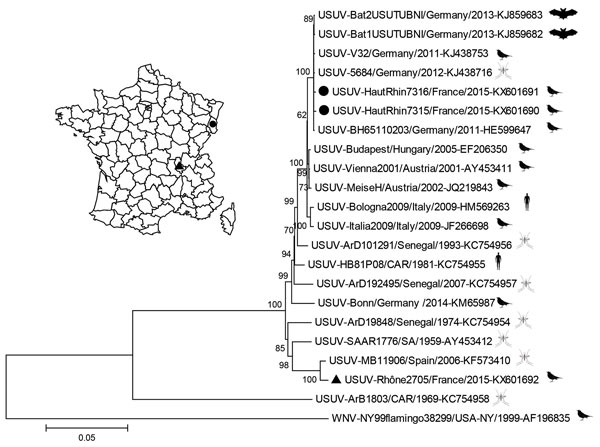
Figure. Phylogeny of Usutu virus (USUV) Haut-Rhin strains (black circles) and Rhône strain (black triangle), isolated in 2015 in eastern France compared with reference strains. Inset map shows locations where isolates were obtained. The strains from France are genetically distinct, with a homology of 95.7% at the nucleotide level and 98.8% (3,392–3 aa/3,434 aa) at the amino acid level. The evolutionary history was inferred by using the neighbor-joining method. The optimal tree with the sum of branch length 0.60224968 is shown. The percentage of replicate trees in which the associated taxa clustered together in the bootstrap test (1,000 replicates) are shown at the nodes. Evolutionary analyses were conducted in MEGA6 (http://www.megasoftware.net), and the evolutionary distances were computed by using the Jukes-Cantor method. The resulting tree is drawn to scale, with branch lengths in the units of number of base substitutions per site. The analysis involved 22 strains, including West Nile virus (WNV) as the root; GenBank accession numbers are indicated. All positions containing gaps and missing data were not included; 10,684 positions were included in the final dataset. An outline of the organism from which the virus was isolated (bat, bird, mosquito, or human) is placed next to the strain name. Scale bar indicates substitutions per site.

Main Article

Page created: November 18, 2016
Page updated: November 18, 2016
Page reviewed: November 18, 2016
The conclusions, findings, and opinions expressed by authors contributing to this journal do not necessarily reflect the official position of the U.S. Department of Health and Human Services, the Public Health Service, the Centers for Disease Control and Prevention, or the authors' affiliated institutions. Use of trade names is for identification only and does not imply endorsement by any of the groups named above.
file_external