Volume 22, Number 2—February 2016
Research
Prognostic Indicators for Ebola Patient Survival
Samuel J. Crowe1 , Matthew J. Maenner1 , Solomon Kuah, Bobbie Rae Erickson, Megan Coffee, Barbara Knust, John D. Klena, Joyce Foday, Darren Hertz, Veerle Hermans, Jay Achar, Grazia M. Caleo, Michel Van Herp, César G. Albariño, Brian Amman, Alison Jane Basile, Scott Bearden, Jessica A. Belser, Eric Bergeron, Dianna Blau, Aaron C. Brault, Shelley Campbell, Mike Flint, Aridth Gibbons, Christin Goodman, Laura McMullan, Christopher D. Paddock, Brandy Russell, Johanna S. Salzer, Angela Sanchez, Tara Sealy, David Wang, Gbessay Saffa, Alhajie Turay, Stuart T. Nichol, and Jonathan S. Towner
Figure 3
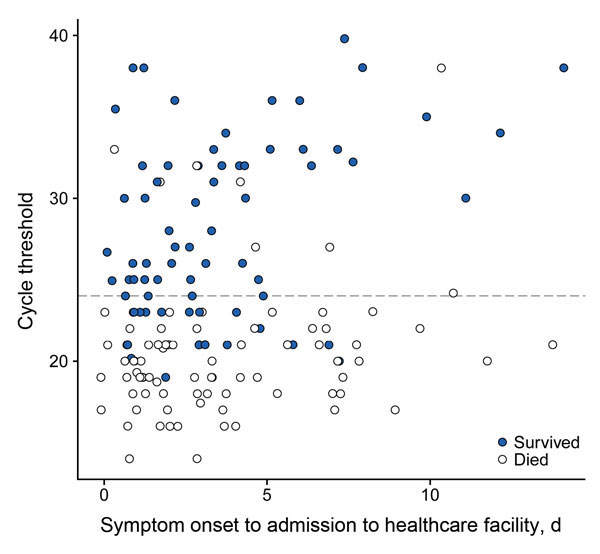
Figure 3. Scatterplot of outcome by cycle threshold (Ct) at time of first Ebola virus–positive test result and time to admission at any healthcare facility (primary cohort, n = 151), Bo District, Sierra Leone, September 2014–January 2015. Each circle represents an infected person. The dashed line indicates the classification threshold of the Ct value of 24. Observations are slightly horizontally jittered to reduce overplotting.
1These authors contributed equally to this article.
Page created: January 14, 2016
Page updated: January 14, 2016
Page reviewed: January 14, 2016
The conclusions, findings, and opinions expressed by authors contributing to this journal do not necessarily reflect the official position of the U.S. Department of Health and Human Services, the Public Health Service, the Centers for Disease Control and Prevention, or the authors' affiliated institutions. Use of trade names is for identification only and does not imply endorsement by any of the groups named above.