Volume 22, Number 2—February 2016
Dispatch
Ebola Virus Persistence in Semen Ex Vivo
Figure 2
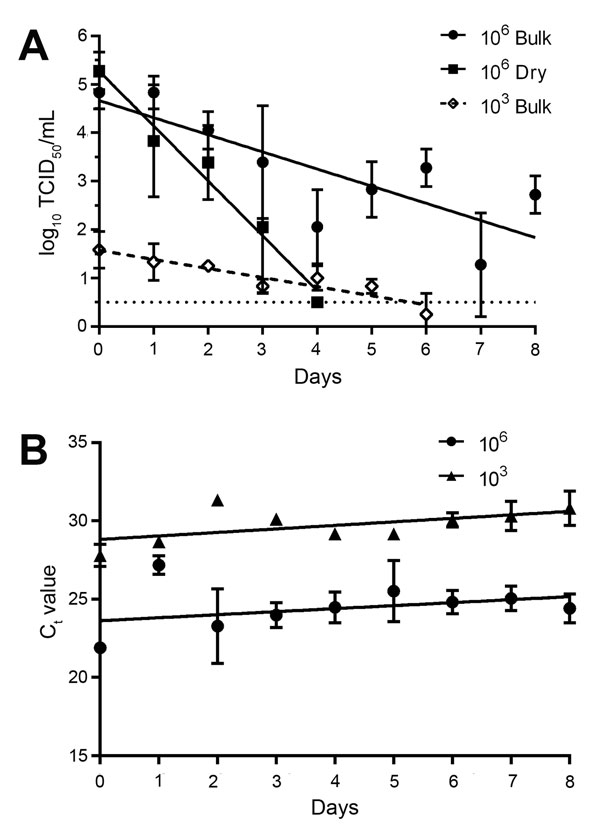
Figure 2. Linear regression model showing stability of Ebola virus (EBOV) and EBOV RNA in semen at 27°C and 80% relative humidity over 8 days. A) EBOV in bulk (liquid) semen versus dry semen at initial titers of 106 TCID50/mL and 103 TCID50/mL. The higher titer 1 × 10⁶ TCID50/mL was used to provide a comparison with EBOV in blood, and the lower titer 1 × 10³ TCID50/mL was derived from Ct values reported in semen samples. Viable virus was reduced significantly faster (p<0.0001) in dry semen than in bulk semen. The goodness-of-fit for the linear regression represented as the r2 value is 0.53 for bulk semen and 0.82 for dry semen with an initial titer of 106 TCID50/mL, respectively, and 0.65 for bulk semen with an initial titer of 103 TCID50/mL. No curve is shown for the initial titer 103 TCID50/mL in the dry semen because no viable virus was recovered after day 1. The titer on day 1 was 1.1 log10 TCID50/mL. In all cases except the high-titer bulk semen sample, the final data point was followed by 2 consecutive days of no recovered virus. B) Ct values produced by analysis of bulk semen samples analyzed by real-time quantitative reverse transcription PCR. The data did not fit a linear regression model (r2 = 0.08964), but the RNA clearly remained stable during the entire experiment. Three biologic replicates were analyzed at each time point. Error bars represent mean ± SEM virus titer. Dashed line indicates the limit of detection for the titration assay. An analysis of covariance was used to compare linear regression models and determine differences in virus reduction rates. Ct, cycle threshold; TCID50, 50% tissue culture infectious dose.