Plasmodium falciparum K76T pfcrt Gene Mutations and Parasite Population Structure, Haiti, 2006–2009
Macarthur Charles, Sanchita Das, Rachel Daniels, Laura Kirkman, Glavdia G. Delva, Rodney Destine, Ananias A. Escalante, Leopoldo Villegas, Noah M. Daniels, Kristi Shigyo, Sarah K. Volkman, Jean W. Pape, and Linnie M. Golightly

Author affiliations: Weill Medical College of Cornell University, New York, New York, USA (M. Charles, S. Das, L. Kirkman, K. Shigyo, J.W. Pape, L.M. Golightly); The Haitian Group for the Study of Kaposi's Sarcoma and Opportunistic Infections Centers (GHESKIO); Port-au-Prince, Haiti (M. Charles, G.G. Delva, R. Destine, J.W. Pape); Harvard T.H. Chan School of Public Health, Boston, Massachusetts, USA (R. Daniels, S.K. Volkman); Broad Institute, Cambridge, Massachusetts, USA (R. Daniels, S.K. Volkman); Temple University, Department of Biology, Philadelphia, Pennsylvania, USA (A. Escalante); ICF International, Rockville, Maryland, USA (L. Villegas); Centro de Investigación de Campo Dr. Francesco Vitanza, Tumeremo, Venezuela (L. Villegas); Massachusetts Institute of Technology, Cambridge (N.M. Daniels); Simmons College, Boston (S.K. Volkman)
Main Article
Figure 4
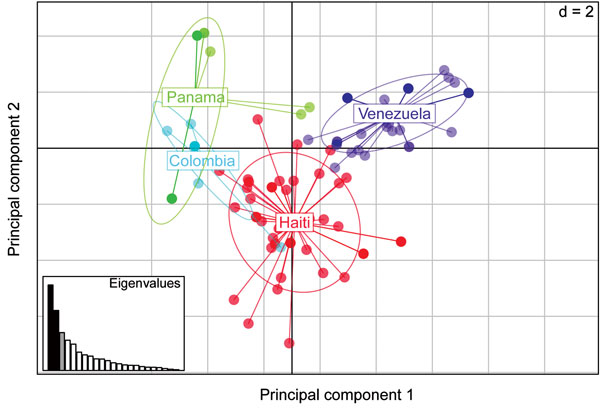
Figure 4. Spatial principal components analysis (sPCA), performed in 2 dimensions (d = 2) comparing malarial parasite population structures based on monogenomic single-nucleotide polymorphism barcodes from Haiti (n = 42), Colombia (n = 7), Panama (n = 37), and Venezuela (n = 31). The x-axis represents the eigenvector associated with the first principal component, which differentiates between populations; the y axis represents the second principal component, which differentiates between samples within the same populations. Inset graph depicts the amount of variability described by the principal components: x-axis indicates individual principal components, y-axis their individual contribution to the observed variance. Black bars, displayed eigenvectors; gray bars, retained principal components; white bars, nonretained principal components.
Main Article
Page created: April 13, 2016
Page updated: April 13, 2016
Page reviewed: April 13, 2016
The conclusions, findings, and opinions expressed by authors contributing to this journal do not necessarily reflect the official position of the U.S. Department of Health and Human Services, the Public Health Service, the Centers for Disease Control and Prevention, or the authors' affiliated institutions. Use of trade names is for identification only and does not imply endorsement by any of the groups named above.