Volume 22, Number 6—June 2016
Research
Extended Human-to-Human Transmission during a Monkeypox Outbreak in the Democratic Republic of the Congo
Leisha Diane Nolen , Lynda Osadebe, Jacques Katomba, Jacques Likofata, Daniel Mukadi, Benjamin Monroe, Jeffrey B. Doty, Christine Marie Hughes, Joelle Kabamba, Jean Malekani, Pierre Lokwa Bomponda, Jules Inonga Lokota, Marcel Pie Balilo, Toutou Likafi, Robert Shongo Lushima, Benoit Kebela Ilunga, Frida Nkawa, Elisabeth Pukuta, Stomy Karhemere, Jean-Jacques Muyembe Tamfum, Beatrice Nguete, Emile Okitolonda Wemakoy, Andrea M. McCollum, and Mary G. Reynolds
Figure 3
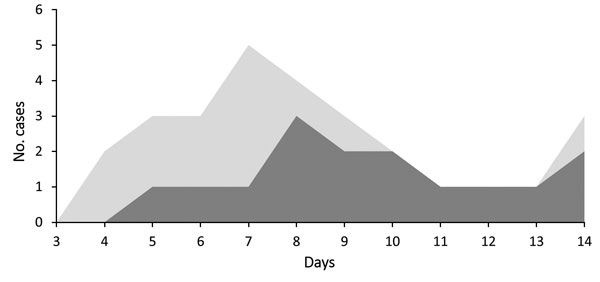
Figure 3. Distribution of incubation periods from 2 separate analyses. Dark gray shows the distribution of incubation periods on the basis of case-patients with well-defined dates of exposure identified in our investigation and in the published literature (n = 16). Light gray shows the distribution of incubation periods from the literature and incubation periods calculated by using the first 2 case-patients in each family (n = 28).
Page created: May 16, 2016
Page updated: May 16, 2016
Page reviewed: May 16, 2016
The conclusions, findings, and opinions expressed by authors contributing to this journal do not necessarily reflect the official position of the U.S. Department of Health and Human Services, the Public Health Service, the Centers for Disease Control and Prevention, or the authors' affiliated institutions. Use of trade names is for identification only and does not imply endorsement by any of the groups named above.