Detection of Multiple Parallel Transmission Outbreak of Streptococcus suis Human Infection by Use of Genome Epidemiology, China, 2005
Pengcheng Du
1, Han Zheng
1, Jieping Zhou
1, Ruiting Lan
1, Changyun Ye, Huaiqi Jing, Dong Jin, Zhigang Cui, Xuemei Bai, Jianming Liang, Jiantao Liu, Lei Xu, Wen Zhang, Chen Chen, Jianguo Xu

, and Chen
Author affiliations: State Key Laboratory for Infectious Disease Prevention and Control, Beijing, China (P. Du, H. Zheng, H. Jing, D. Jin, Z. Cui, X. Bai, L. Xu, W. Zhang, C. Chen, J. Xu); Academy of Sciences of China Institute of Remote Sensing and Digital Earth, Beijing (J. Zhou, J. Liang, J. Liu); University of New South Wales School of Biotechnology and Biomolecular Sciences, Sydney, Australia (R. Lan); Collaborative Innovation Center for Diagnosis and Treatment of Infectious Diseases, Beijing (C. Ye, J. Xu); National Institute for Communicable Disease Control and Prevention, Beijing (D. Jin)
Main Article
Figure 1
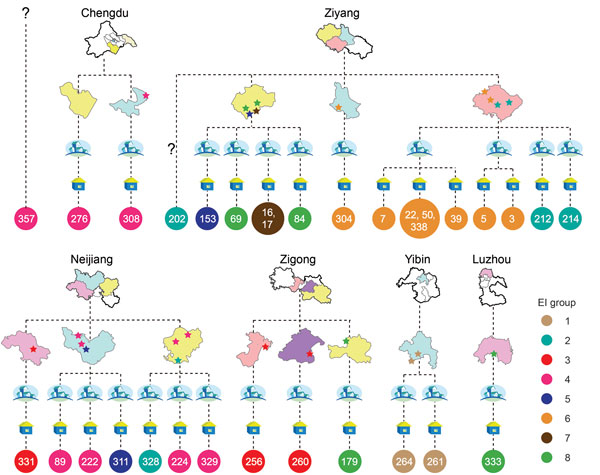
Figure 1. Geographic locations of resident villages of persons infected during outbreak of Streptococcus suis identified by whole-genome sequencing as minimum core genome type 1 sequence type 7, Sichuan Province, China, 2005. The 4 levels of administrative divisions (city, county, town, and village) are displayed to show the geographic locations and relationships of isolates. Drawings of the cities and counties are simplified maps of those territories. Towns are depicted with 4 houses, and villages are depicted with 1 house. Stars indicate the locations of patients infected by isolates of the 8 epidemiologically interesting groups, and isolates in the same group are shown in the same color. Circles with numbers represent the isolates, and colors are consistent with the color of the stars. Locations of some isolates were too close to distinguish them on the map (e.g., SC7, SC22, SC50, SC338, and SC39). EI, epidemiologically interesting.
Main Article
Page created: January 17, 2017
Page updated: January 17, 2017
Page reviewed: January 17, 2017
The conclusions, findings, and opinions expressed by authors contributing to this journal do not necessarily reflect the official position of the U.S. Department of Health and Human Services, the Public Health Service, the Centers for Disease Control and Prevention, or the authors' affiliated institutions. Use of trade names is for identification only and does not imply endorsement by any of the groups named above.