Correlation of West Nile Virus Incidence in Donated Blood with West Nile Neuroinvasive Disease Rates, United States, 2010–2012
Edouard Betsem, Zhanna Kaidarova, Susan L. Stramer, Beth Shaz, Merlyn Sayers, German LeParc, Brian S. Custer, Michael P. Busch

, and Edward L. Murphy
Author affiliations: University of Yaounde 1 Faculty of Medicine and Biomedical Sciences, Yaounde, Cameroon (E. Betsem); Agence de Médecine Préventive, Bobo-Dioulasso, Burkina Faso (E. Betsem); Blood Systems Research Institute, San Francisco, California, USA (E. Betsem, Z. Kaidarova, B. Custer, M.P. Busch, E.L. Murphy); American Red Cross, Gaithersburg, Maryland, USA (S.L. Stramer); New York Blood Center, New York, New York, USA (B. Shaz); Carter BloodCare, Bedford, Texas, USA (M. Sayers); University of Texas Southwestern Medical Center, Dallas, Texas, USA (M. Sayers); OneBlood, St. Petersburg, Florida, USA (G. LeParc); University of California, San Francisco (B. Custer, M.P. Busch, E.L. Murphy)
Main Article
Figure 4
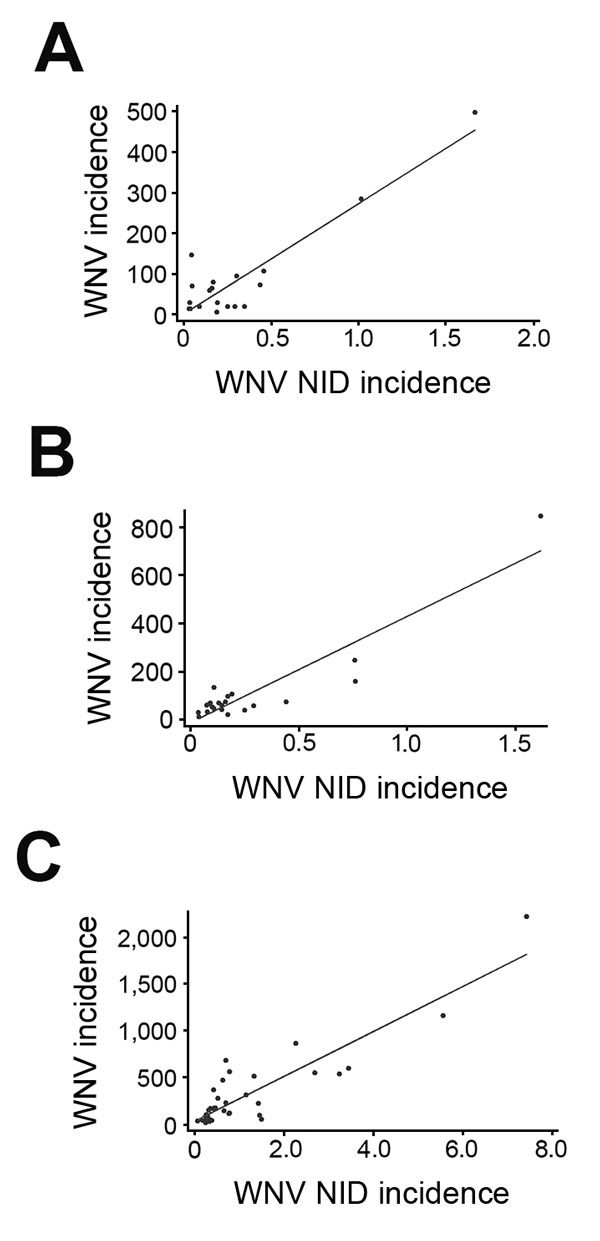
Figure 4. Projected West Nile virus (WNV) incidence (per 100,000 population) versus neuroinvasive disease (NID) case rates (per 100,000 population) by state, United States, 2010–2012. Each dot within each panel represents 1 state. A) Data for 2010. Data from 30 states were excluded: 11 states with no donors testing positive by nucleic acid testing (NAT) and no NID cases; 17 states with 1–26 NID cases but no NAT-positive donors; and 2 states with 1 and 2 NAT-positive donors, respectively, but no reported NID cases (R2 = 0.83). B) Data for 2011. Data from 27 states were excluded: 8 states with neither NAT testing yield nor NID cases and 19 states with 1–31 NID cases but no NAT yield (R2 = 0.83). C) Data for 2012. Data from 15 states were excluded: 3 states with neither NAT testing yield nor NID cases and 12 states with 1–62 neuroinvasive cases but no NAT yield (R2 = 0.79).
Main Article
Page created: January 17, 2017
Page updated: January 17, 2017
Page reviewed: January 17, 2017
The conclusions, findings, and opinions expressed by authors contributing to this journal do not necessarily reflect the official position of the U.S. Department of Health and Human Services, the Public Health Service, the Centers for Disease Control and Prevention, or the authors' affiliated institutions. Use of trade names is for identification only and does not imply endorsement by any of the groups named above.