Skip directly to site content Skip directly to page options Skip directly to A-Z link Skip directly to A-Z link Skip directly to A-Z link
Volume 23, Number 2—February 2017
Dispatch

Changing Epidemiology of Hepatitis A and Hepatitis E Viruses in China, 1990–2014

Xiang Ren1, Peng Wu1, Liping Wang1, Mengjie Geng, Lingjia Zeng, Jun Zhang, Ningshao Xia, Shengjie Lai, Harry R. Dalton, Benjamin J. Cowling2, and Sheng Wei2Comments to Author 
Author affiliations: Key Laboratory of Surveillance and Early-Warning on Infectious Disease, Chinese Center for Disease Control and Prevention, Beijing, China (X. Ren, L. Wang, M. Geng, L. Zeng, S. Lai, H. Yu); World Health Organization Collaborating Centre for Infectious Disease Epidemiology and Control, Li Ka Shing Faculty of Medicine, The University of Hong Kong, Hong Kong, China (X. Ren, P. Wu, B. Cowling); State Key Laboratory of Molecular Vaccinology and Molecular Diagnostics, National Institute of Diagnostics and Vaccine Development in Infectious Diseases, Xiamen University School of Public Health, Xiamen, China (J. Zhang, N. Xia); University of Southampton, Southampton, UK (S. Lai); Royal Cornwall Hospital and European Centre for Environment and Human Health, University of Exeter, Truro, UK (H.R. Dalton); Fudan University School of Public Health, Key Laboratory of Public Health Safety, Ministry of Education, Shanghai, China (H. Yu)

Main Article

Figure 2

Age distribution of patients with reported cases of A) hepatitis A (blue, male patients; green, female patients) and B) hepatitis E (red, male patients; purple, female patients) in China for 1990–1999, 2000–2009, and 2010–2014. Incidence and mortality rates were calculated in 10-year age groups for the 3 periods. For each color, the darker shade represents incidence and the lighter shade represents mortality rate.

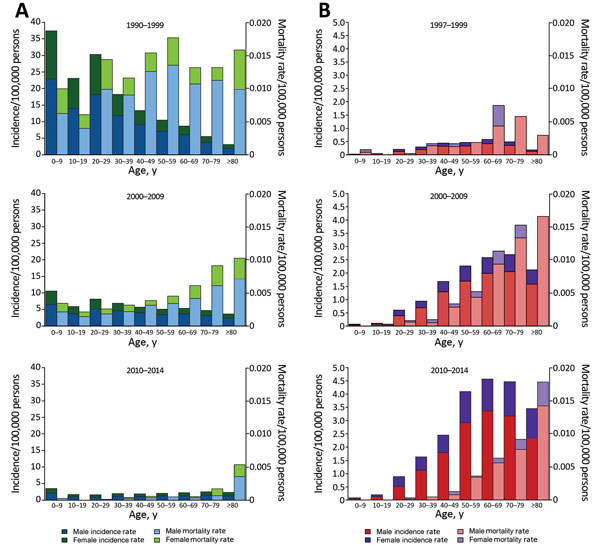
Figure 2. Age distribution of patients with reported cases of A) hepatitis A (blue, male patients; green, female patients) and B) hepatitis E (red, male patients; purple, female patients) in China for 1990–1999, 2000–2009, and 2010–2014. Incidence and mortality rates were calculated in 10-year age groups for the 3 periods. For each color, the darker shade represents incidence and the lighter shade represents mortality rate.

Main Article

1These authors contributed equally to this article.

2These authors are joint senior authors.

Page created: January 17, 2017
Page updated: January 17, 2017
Page reviewed: January 17, 2017
The conclusions, findings, and opinions expressed by authors contributing to this journal do not necessarily reflect the official position of the U.S. Department of Health and Human Services, the Public Health Service, the Centers for Disease Control and Prevention, or the authors' affiliated institutions. Use of trade names is for identification only and does not imply endorsement by any of the groups named above.
file_external