Skip directly to site content Skip directly to page options Skip directly to A-Z link Skip directly to A-Z link Skip directly to A-Z link
Volume 23, Number 2—February 2017
Research

Swine Influenza Virus (H1N2) Characterization and Transmission in Ferrets, Chile

Nicolás Bravo-Vasquez1, Erik A. Karlsson1, Pedro Jimenez-Bluhm, Victoria Meliopoulos, Bryan Kaplan, Shauna Marvin, Valerie Cortez, Pamela Freiden, Melinda A. Beck, and Stacey Schultz-Cherry2Comments to Author 
Author affiliations: University of Chile, Santiago, Chile (N. Bravo-Vasquez, C. Hamilton-West); St. Jude Children’s Research Hospital, Memphis, Tennessee, USA (E.A. Karlsson, P. Jimenez-Bluhm, V. Meliopoulos, B. Kaplan, S. Marvin, V. Cortez, P. Freiden, S. Schultz-Cherry); University of North Carolina, Chapel Hill, North Carolina, USA (M.A. Beck)

Main Article

Figure 7

Evaluation of serologic responses of humans to H1 viruses by age. Hemagglutination inhibition (HI) studies were performed for CA/09 (A), sw/Chile (B), sw/IA (C), and Mem/87 (D) viruses by using human serum samples (n = 137) collected as part of an ongoing prospective observational study carried out at the University of North Carolina Family Medicine Center (Chapel Hill, NC, USA) in 2009–2015. A subset of the available samples were chosen from persons whose serum samples were collected 28–32 days

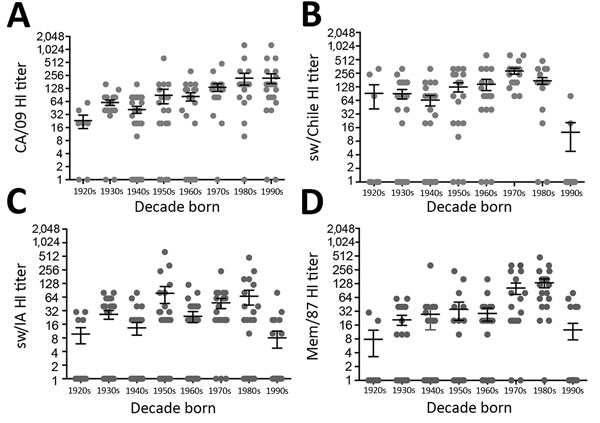
Figure 7. Evaluation of serologic responses of humans to H1 viruses by age. Hemagglutination inhibition (HI) studies were performed for CA/09 (A), sw/Chile (B), sw/IA (C), and Mem/87 (D) viruses by using human serum samples (n = 137) collected as part of an ongoing prospective observational study carried out at the University of North Carolina Family Medicine Center (Chapel Hill, NC, USA) in 2009–2015. A subset of the available samples were chosen from persons whose serum samples were collected 28–32 days after seasonal influenza vaccination. Samples were grouped by decade of birth (1920–1929, 1930–1939, 1940–1949, 1950–1959, 1960–1969, 1970–1979, 1980–1989, and 1990–1999). Groups consisted of samples from 7–22 persons and were balanced for sex and age whenever possible. Gray dots represent inverse HI titers of individual persons and bars represent mean HI titer ± SEM per decade born.

Main Article

1These first authors contributed equally to this article.

2These senior authors contributed equally to this article.

Page created: January 17, 2017
Page updated: January 17, 2017
Page reviewed: January 17, 2017
The conclusions, findings, and opinions expressed by authors contributing to this journal do not necessarily reflect the official position of the U.S. Department of Health and Human Services, the Public Health Service, the Centers for Disease Control and Prevention, or the authors' affiliated institutions. Use of trade names is for identification only and does not imply endorsement by any of the groups named above.
file_external