Skip directly to site content Skip directly to page options Skip directly to A-Z link Skip directly to A-Z link Skip directly to A-Z link
Volume 23, Number 3—March 2017
Research

New Mycobacterium tuberculosis Complex Sublineage, Brazzaville, Congo

Sven Malm, Laure S. Ghoma Linguissi, Emmanuel M. Tekwu, Jeannhey C. Vouvoungui, Thomas A. Kohl, Patrick Beckert, Anissa Sidibe, Sabine Rüsch-Gerdes, Igor K. Madzou-Laboum, Sylvie Kwedi, Véronique Penlap Beng, Matthias Frank, Francine Ntoumi, and Stefan NiemannComments to Author 
Author affiliations: Leibniz Center for Medicine and Biosciences, Borstel, Germany (S. Malm, T.A. Kohl, P. Beckert, S. Rüsch-Gerdes, S. Niemann); Fondation Congolaise pour la Recherche Médicale, Brazzaville, Congo (L.S. Ghoma Linguissi, J.C. Vouvoungui, A. Sidibe, S. Kwedi, F. Ntoumi); University Marien Ngouabi, Brazzaville (L.S. Ghoma Linguissi, J.C. Vouvoungui, A. Sidibe, F. Ntoumi); University of Yaoundé I, Yaoundé, Cameroon (E.M. Tekwu, V. Penlap Beng); Institute for Tropical Medicine, University of Tübingen, Tübingen, Germany (E.M. Tekwu, M. Frank, F. Ntoumi); Centre Antituberculeux de Brazzaville, Brazzaville (I.K. Madzou-Laboum); German Center for Infection Research, Tübingen Site, Tübingen (M. Frank); German Center for Infection Research, Borstel Site, Borstel (S. Niemann)

Main Article

Figure 2

Maximum parsimony tree of Mycobacterium tuberculosis complex isolates from Congo. The tree was calculated on the basis of the concatenated single-nucleotide polymorphism (SNP) list. Branch labels indicate SNP distances; node labels represent the strain identifiers. Clusters based on pairwise comparisons were plotted on the tree: clusters <5 SNPs, nodes filled in black; clusters <12 SNPs, nodes with bold black outlines.

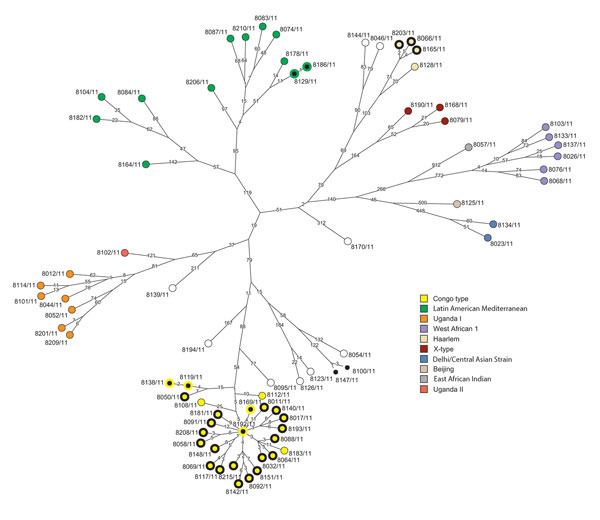
Figure 2. Maximum parsimony tree of Mycobacterium tuberculosis complex isolates from Congo. The tree was calculated on the basis of the concatenated single-nucleotide polymorphism (SNP) list. Branch labels indicate SNP distances; node labels represent the strain identifiers. Clusters based on pairwise comparisons were plotted on the tree: clusters <5 SNPs, nodes filled in black; clusters <12 SNPs, nodes with bold black outlines.

Main Article

Page created: February 17, 2017
Page updated: February 17, 2017
Page reviewed: February 17, 2017
The conclusions, findings, and opinions expressed by authors contributing to this journal do not necessarily reflect the official position of the U.S. Department of Health and Human Services, the Public Health Service, the Centers for Disease Control and Prevention, or the authors' affiliated institutions. Use of trade names is for identification only and does not imply endorsement by any of the groups named above.
file_external