Whole-Genome Analysis of Bartonella ancashensis, a Novel Pathogen Causing Verruga Peruana, Rural Ancash Region, Peru
Kristin E. Mullins
12
, Jun Hang
2, Robert J. Clifford
2, Fatma Onmus-Leone, Yu Yang, Ju Jiang, Mariana Leguia, Matthew R. Kasper, Ciro Maguina, Emil P. Lesho, Richard G. Jarman, Allen L. Richards, and David Blazes
Author affiliations: Uniformed Services University of the Health Sciences, Bethesda, Maryland, USA (K.E. Mullins, J. Jiang, A. Richards, D. Blazes); US Naval Medical Research Center, Silver Spring, Maryland, USA (K.E. Mullins, A. Richards); Walter Reed Army Institute of Research, Silver Spring (J. Hang, R.J. Clifford, F. Onmus-Leone, Y. Yang, E.P. Lesho, R.G. Jarman); US Naval Medical Research Unit No. 6, Lima, Peru (M. Leguia, M.R. Kasper); Universidad Peruana Cayetano Heredia, Lima (C. Maguina)
Main Article
Figure 2
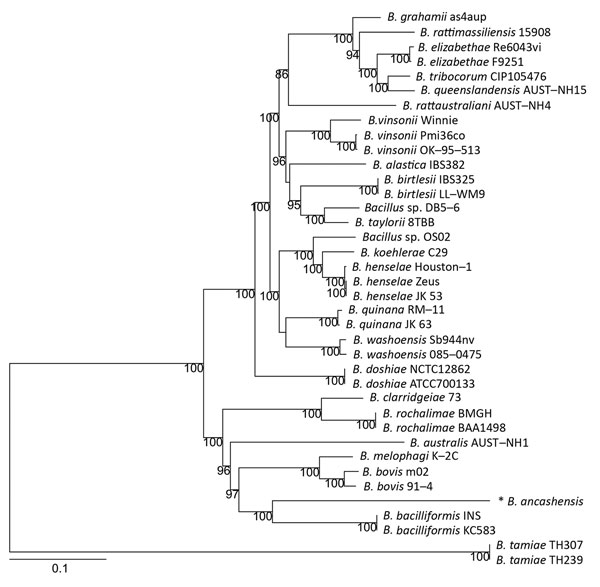
Figure 2. Phylogenetic relationship of Bartonella ancashensis isolates from patients with verruga peruana, rural Ancash region, Peru, with other Bartonella species based on whole-genome phylogeny. The tree is based on single-nucleotide polymorphisms identified in genomic regions common to all Bartonella strains examined. The initial tree was constructed by using the neighbor-joining algorithm and was optimized by using the parsimony maximum-likelihood method. Tree stability was evaluated by using 100 bootstrap replications. Asterisk indicates strain isolated in this study. Numbers along branches are bootstrap values. Scale bar indicates nucleotide substitutions per site.
Main Article
Page created: February 17, 2017
Page updated: February 17, 2017
Page reviewed: February 17, 2017
The conclusions, findings, and opinions expressed by authors contributing to this journal do not necessarily reflect the official position of the U.S. Department of Health and Human Services, the Public Health Service, the Centers for Disease Control and Prevention, or the authors' affiliated institutions. Use of trade names is for identification only and does not imply endorsement by any of the groups named above.