Zika Virus RNA Replication and Persistence in Brain and Placental Tissue
Julu Bhatnagar

, Demi B. Rabeneck, Roosecelis B. Martines, Sarah Reagan-Steiner, Yokabed Ermias, Lindsey B.C. Estetter, Tadaki Suzuki, Jana M. Ritter, M. Kelly Keating, Gillian Hale, Joy Gary, Atis Muehlenbachs, Amy J. Lambert, Robert Lanciotti, Titilope Oduyebo, Dana Meaney-Delman, Fernando Bolaños, Edgar Alberto Parra Saad, Wun-Ju Shieh, and Sherif Zaki
Author affiliations: Centers for Disease Control and Prevention, Atlanta, Georgia, USA (J. Bhatnagar, D.B. Rabeneck, R.B. Martines, S. Reagan-Steiner, Y. Ermias, L.B.C. Estetter, T. Suzuki, J. Ritter, M.K. Keating, G. Hale, J. Gary, A. Muehlenbachs, T. Oduyebo, D. Meaney-Delman, W. Shieh, S.R. Zaki); Centers for Disease Control and Prevention, Fort Collins, Colorado, USA (A. Lambert, R. Lanciotti); Patología Hospital Universitario de Neiva, Neiva, Colombia (F. Bolaños); Instituto Nacional de Salud, Bogota, Colombia (E.A. Parra Saad)
Main Article
Figure 1
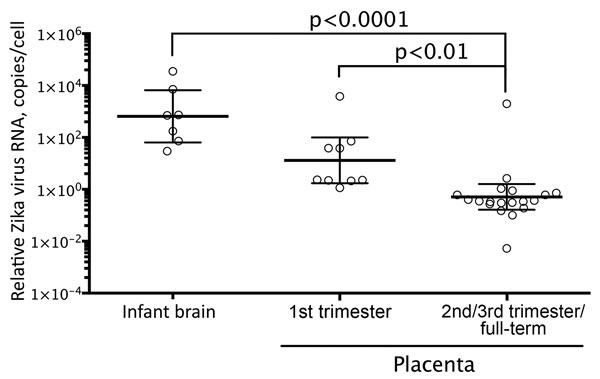
Figure 1. Zika virus RNA load levels in human brain and placental tissues. The scatter plot graph shows the relative levels of Zika virus RNA in formalin-fixed, paraffin-embedded tissue sections, which were quantified by real-time quantitative reverse transcription PCR by using primer-probe sets for Zika virus envelope gene and β-actin mRNA. β-actin mRNA was used as an internal reference gene that provided a normalization factor for the amount of RNA extracted from a section. The copy number of Zika virus RNA per cell was calculated using β-actin mRNA copy number, which was estimated to be 1,500 copies/cell. The graph shows individual data points and superimposed horizontal lines at the geometric mean, and error bars show the 95% CI for that geometric mean. p values were calculated with nonparametric 1-way analysis of variance (Kruskal-Wallis test) followed by Dunn multiple comparison tests. The relative Zika virus RNA copy numbers for second/third trimester or full-term placentas were statistically significantly lower than those for first trimester placentas or infant brain tissues.
Main Article
Page created: February 17, 2017
Page updated: February 17, 2017
Page reviewed: February 17, 2017
The conclusions, findings, and opinions expressed by authors contributing to this journal do not necessarily reflect the official position of the U.S. Department of Health and Human Services, the Public Health Service, the Centers for Disease Control and Prevention, or the authors' affiliated institutions. Use of trade names is for identification only and does not imply endorsement by any of the groups named above.