Volume 23, Number 4—April 2017
Research
Plasmodium malariae Prevalence and csp Gene Diversity, Kenya, 2014 and 2015
Abstract
In Africa, control programs that target primarily Plasmodium falciparum are inadequate for eliminating malaria. To learn more about prevalence and genetic variability of P. malariae in Africa, we examined blood samples from 663 asymptomatic and 245 symptomatic persons from western Kenya during June–August of 2014 and 2015. P. malariae accounted for 5.3% (35/663) of asymptomatic infections and 3.3% (8/245) of clinical cases. Among asymptomatic persons, 71% (32/45) of P. malariae infections detected by PCR were undetected by microscopy. The low sensitivity of microscopy probably results from the significantly lower parasitemia of P. malariae. Analyses of P. malariae circumsporozoite protein gene sequences revealed high genetic diversity among P. malariae in Africa, but no clear differentiation among geographic populations was observed. Our findings suggest that P. malariae should be included in the malaria elimination strategy in Africa and highlight the need for sensitive and field-applicable methods to identify P. malariae in malaria-endemic areas.
Over the past decade, malaria control strategies in Africa have reduced the number of malaria cases and deaths. Nevertheless, non–Plasmodium falciparum malaria still presents a major challenge for malaria elimination (1,2). Global malaria elimination programs focus primarily on P. falciparum. Recent research efforts and control programs have drawn resources to P. vivax malaria. By contrast, P. malariae and P. ovale receive little attention, and malaria caused by these organisms is among the most neglected tropical diseases (3). In those rural areas of Africa where malaria is most common, affordable diagnostic tools are rapid diagnostic tests and microscopy, but they are not effective for detecting these 2 species, mainly because parasitemia with these species is low (4–6). As a result, P. malariae and P. ovale infections are often underestimated, and epidemiologic information, such as distribution and prevalence of these species in malaria-endemic areas, is lacking. This knowledge is essential for implementation of specific strategies for monitoring and eliminating all types of malaria where it is endemic to Africa.
Although P. malariae infection is often asymptomatic and rarely leads to severe clinical illness or death, this species causes a low-grade chronic infection that persists for decades and is associated with nephropathy and anemia (7–9). The persistence, as well as submicroscopic features of P. malariae, have contributed to intermittent outbreaks of malaria in the Colombian Amazon region (10). In addition, P. malariae can cause irreversible stage 5 kidney failure (11). The prevalence of this species may increase the risk for kidney injuries and impair renal function, particularly in children with no immunity against P. malariae. Ample evidence shows peak prevalence for severe and uncomplicated clinical P. falciparum malaria among infants and children in sub-Saharan Africa (12–14). Contrary to this age pattern, patients with P. malariae infections in Papua, Indonesia, were older (median 22 years of age) than those with non–P. malariae infections (e.g., P. vivax; median 10 years of age) (9). Knowledge of the age patterns of patients with P. malariae infection is critical for understanding its epidemiology and developing effective preventative strategies.
Compared with the distribution of P. falciparum and P. vivax, the distribution of P. malariae is relatively sparse and variable. P. malariae is endemic to West Africa (3), South America (15), Asia (16,17), and the western Pacific region (18,19). Knowledge of genetic variation among isolates from these geographic areas is still lacking. One study indicated a remarkably low level of sequence diversity at the msp1 locus in P. malariae from Brazil (20). Similarly, the lack of variation at the dhfr and dhps loci has been shown for P. malariae from Asia and the western Pacific region (21,22). These findings suggested that antimalarial drugs might be imposing selective pressure on the genetic diversity of P. malariae. The circumsporozoite protein (csp) gene, which is known to be critical for plasmodia sporozoite motility and hepatocyte invasion (23), has been shown to be variable in length and is a sequence of the tandemly repeated peptide units in P. falciparum (24,25), P. vivax (26,27), and P. malariae isolates from Central Africa (28). The vast antigenic variation observed in P. falciparum as a result of immune selection pressure can influence the capacity of mosquito transmission and the effectiveness of malaria vaccine (29). In this study, we sought to determine the prevalence of infection and age distribution of persons with asymptomatic and symptomatic P. malariae infection in western Kenya, the genetic affinity between P. malariae isolates from East Africa and other regions, and the level of csp gene diversity among P. malariae and the significance of this diversity.
Scientific and ethical clearance was given by the institutional scientific and ethical review boards of the Kenya Medical Research Institute and the University of California Irvine. Written informed consent/assent for study participation was obtained from all consenting heads of households, parents/guardians (for minors <18 years of age), and each person who was willing to participate in the study.
Study Areas and Participants
Figure 1
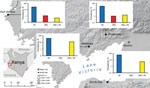
Figure 1. Location of sites in western Kenya for study of Plasmodium malariae prevalence and circumsporozoite protein gene diversity, Kenya, 2014 and 2015. Prevalence (logarithmic vertical scales) of P. falciparum monoinfections (PF), P....
During June–August of 2014 and 2015, blood samples were collected from persons in 4 villages at the Lake Victoria basin (elevation ≈1,000 m) of western Kenya (Figure 1). These villages represent parts of the Lake Victoria area previously shown by nested and quantitative PCR (qPCR) methods to have high, stable rates of malaria transmission and prevalence (10%–40%) among children 5–14 years of age (30,31).
Community samples were collected from nonfebrile schoolchildren in 7 public primary schools (70–100 children/school, 2 schools/village except Kombewa). An equal number of boys and girls 6–15 years of age were randomly selected from each school. To determine P. malariae prevalence in the adult population, we randomly selected 63 persons (32 male and 31 female) >15 years of age from 18 households in Kombewa. We examined a total of 663 samples from the communities, which provided an estimation of 4% margin of error in parasite prevalence with 0.05 type I error. At the time of sampling, none of these persons exhibited fever or malaria-related symptoms.
Clinical samples were collected from 113 male and 132 female patients, <1 to 76 years of age, in 3 district hospitals. This sample size provided an estimation of 6% margin of error in parasite prevalence with 0.05 type I error. These patients had fever or malaria-related signs or symptoms and were determined to be positive for Plasmodium spp. by microscopy at the time of sampling. Thick and thin blood smears were prepared for microscopic examination to determine the Plasmodium species, and ≈50 μL blood was blotted onto Whatman 3MM filter (Sigma Aldrich, St. Louis, MO, USA) papers. Filter papers were air dried and stored in zip-sealed plastic bags with silica gel absorbent at room temperature until DNA extraction.
Microscopy and PCR of Plasmodium spp.
We examined slides under microscopes at 100× magnification and counted the number of parasites per 200 leukocytes. A slide was considered negative when no parasites were observed after counting >100 microscopic fields. At the time of sample collection, all slides were read by 2 microscopists. If counts were discordant, the slides were examined by a third microscopist. The density of parasitemia was expressed as the number of asexual parasites per microliter of blood, assuming a leukocyte count of 8,000 cells/μL, according to World Health Organization guidelines.
We extracted parasite DNA from half of a dried blood spot by using the Saponin/Chelex method (32). The final extracted volume was 200 μL. For all samples, nested amplification of the 18S rRNA gene region of plasmodia (P. falciparum, P. vivax, P. malariae, and P. ovale) was used for parasite detection and species identification. As positive controls for all amplifications, we used DNA from P. falciparum isolates 7G8 (MR4-MRA-926) and HB3 (MR4-MRA-155), P. vivax Pakchong (MR4-MRA-342G) and Nicaragua (MR4-MRA-340G), P. malariae (MR4-MRA-179), and P. ovale (MR4-MRA-180). As negative controls, we used water and noninfected samples to ensure lack of contamination. Reaction was performed in a Bio-Rad MyCycler thermal cycler according to the published protocol (33) (details in Technical Appendix 1).
In addition, the amount of parasite DNA was estimated by using the SYBR Green (Thermo Scientific, Foster City, CA, USA) qPCR detection method with Plasmodium species–specific primers that targeted the 18S rRNA genes (34,35). Reactions were performed in a CFX96 Touch Real-Time PCR Detection System (Bio-Rad, Foster City, CA, USA). To confirm specific amplifications of the target sequence, we performed melting curve analyses for each amplified sample. To measure reproducibility of the cycle threshold (Ct), we calculated the mean value and standard deviations from triplicates in 2 independent assays. The parasite gene copy number in a sample was quantified according to Ct by using the equation (30) GCNsample = e(E × ΔCtsample), where GCN stands for gene copy number; ΔCt, the difference in Ct between the negative control and the sample; e, exponential function; and E, amplification efficiency (Technical Appendix 1).
CSP Sequencing and Phylogenetic Analyses
Four internal primers were designed specifically on the P. malariae csp gene region and used together with the published primers (28; Technical Appendix 1 Table) to unambiguously amplify the 3 segments, the N terminal, the central repeat, and the C-terminal regions of the csp gene. A total of 37 P. malariae isolates were amplified and sequenced. All resulted sequences were verified by comparing them with those in the GenBank database by using BLAST (https://blast.ncbi.nlm.nih.gov/Blast.cgi). Sequences were translated into protein sequences and analyzed together with all csp protein sequences available in GenBank of P. malariae from East Africa (Kenya and Uganda), West Africa (Cameroon), Central Africa (Côte d’Ivoire), and South America (Venezuela) and of P. brasilianum from South America (Brazil and Venezuela). It is noteworthy that although P. malariae and P. brasilianum coexist in Brazil, no csp sequence for P. malariae is available. Because of the potential for alignment errors associated with gaps in the nucleotide sequences, we used translated amino acid sequences with unambiguous indels in phylogenetic analyses. Sequence diversity, including measures of evolutionary distances and average pairwise divergence, were estimated and compared among geographic regions (Technical Appendix 1).
Statistical Analyses
A 1-tailed t-test was used to test for the significance of differences in parasite gene copy number between P. malariae from symptomatic and asymptomatic patients and between P. malariae and P. falciparum in co-infected samples. In addition, we calculated the Pearson correlation coefficient (r2) for parasite gene copy number and age by using R (https://www.r-project.org/).
Results
P. malariae Prevalence and Patient Age Distribution
Among the 663 samples from asymptomatic persons, P. malariae was detected by PCR in 35 (5.3% prevalence). Among these, 29 were mixed infections (with P. falciparum) and 6 were P. malariae monoinfections (Figure 1; Table 1). P. malariae was found to be most prevalent in Kombewa (14.3%, 19/133 cases), followed by Kendu Bay (5.3%, 8/150 cases). Prevalence of P. falciparum prevalence was relatively high at these 2 sites (44% and 59%, respectively; Table 1). In Kombewa, 13 of 19 P. malariae cases were detected in younger persons (<15 years of age), which was significantly higher than the number of cases detected in older persons (6 cases, p = 0.04; Table 1). Although such a comparison between age groups cannot be made for the other sites, a similar pattern was observed for symptomatic patients.
Among the 245 samples from symptomatic patients, 8 (3.3%) P. malariae cases were detected; 6 were mixed infections with P. falciparum and 2 were P. malariae monoinfections (Table 2). When the samples were stratified by patient age, all P. malariae infections in symptomatic persons were in infants or very young children of <5 years of age (8/135, 5.9% infection rate). Although P. falciparum infection was highest among patients >5 to <15 years of age, no P. malariae was detected in persons in this and older age groups despite smaller samples in these groups. No significant difference was detected between male and female patients.
Comparisons of Diagnostic Approaches and Parasitemia
Compared with microscopy, nested PCR revealed a significantly higher number of P. malariae infections in the community (Table 3). All samples that were P. malariae positive by microscopy were identified as positive by PCR and qPCR. Across the study sites, nested PCR–based prevalence ranged from 0 to 12.2% (average 4.8%), >2-fold higher than by microscopy (0 to 3.8%, average 1.9%; Table 3). The discrepancy between the 2 methods was also reflected by the difference in P. falciparum prevalence; 10% more positive infections were detected by nested PCR than by microscopy. Nevertheless, such a discrepancy was not as substantial as that for P. malariae.
Figure 2
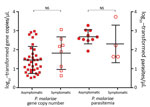
Figure 2. Parasite gene copy numbers (per microliter) detected by SYBR Green (Thermo Scientific, Foster City, CA, USA) quantitative PCR and parasitemia (parasites per microliter) determined by microscopy of Plasmodium malariae samples from...
Although the number of P. malariae–positive clinical samples detected in this study was low, these samples indicated an overlapping range of parasite gene copy number (geometric mean 6.4 × 101/μL, range 4.3 × 101 to 1.2 × 10³/μL; Figure 2) with that of the samples from asymptomatic persons (geometric mean 4.8×101/μL, range 0.5 ×101 to 9.4 ×10²/μL) without differing significantly (p>0.05). Similar results were observed in the level of P. malariae parasitemia, for which samples from symptomatic and asymptomatic persons did not differ significantly (Figure 2). Parasite gene copy number and P. malariae parasitemia were significantly positively correlated with each other (r2 = 0.77, p<0.01; Technical Appendix 1 Figure 1).
Figure 3
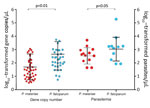
Figure 3. Plasmodium malariae and P. falciparum parasite gene copy numbers (per microliter) and parasitemia (parasites per microliter) in co-infected samples. Median, first quartile, and fourth quartile of the data are shown for...
Parasite gene copy number and parasitemia for P. falciparum were generally higher than those for P. malariae (Figure 3, panel A). Among the 35 mixed infections, 28 (80%) gene copy numbers were higher for P. falciparum than for P. malariae (Technical Appendix 1 Figure 2). Among these samples overall, the amount of P. falciparum DNA (geometric mean 1.6 × 10²/μL, range 1 × 101 to 5.5× 10³/μL) was significantly higher than the amount of P. malariae DNA (geometric mean 4.7 × 101/μL, range 0.4 × 101 to 1.1 × 10³/μL; p = 0.003), consistent with the difference in parasitemia according to microscopy (P. malariae geometric mean 3.2 × 10² parasites/μL vs. P. falciparum geometric mean 1.1 × 10³ parasites/μL; Technical Appendix 1 Figure 2).
When all P. malariae samples were pooled, the parasite gene copy number did not correlate significantly with patient age (r2 = 0.07; Technical Appendix 1 Figure 3). Neither P. malariae prevalence rate nor parasite gene copy number differed significantly according to patient sex.
Genetic Relatedness and csp Divergence of P. malariae
The csp alignment comprised 530 aa, of which 34 (6.4%) were polymorphic among the studied parasites of different taxa (Technical Appendix 2). To avoid polymorphism caused by PCR error, we sequenced each isolate at least twice in both directions. Substantial length variation was observed in the central repeat region, where the number of NAAGn (the repeat codon unit in which n denotes the number of repeats) in P. malariae ranged from 49 to 85 units. These tandem repeats could be rapidly evolving through a different mechanism and may influence genetic relationships among the samples. To examine such effect, we constructed phylogenetic trees with 2 sets of data: the entire sequence (530 aa) and partial sequences without the central repeat region (225 aa).
Figure 4
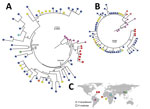
Figure 4. Maximum-likelihood analyses of circumsporozoite protein gene (csp) sequences of Plasmodium malariae and distribution of the samples. A) Phylogenetic tree based on maximum-likelihood analyses of the entire csp amino acid sequences of...
Maximum-likelihood analyses of the entire csp gene showed a clear distinction between isolates from South America and those from the other geographic regions (Figure 4, panel A). P. brasilianum and P. malariae from Venezuela formed a monophyletic group (bootstrap >95%) closely associated with P. brasilianum from Brazil. Sequences of P. malariae from Venezuela were almost identical to those of P. brasilianum from the same area. Closely related to the clade from South America was a large monophyletic group that contained P. malariae from East, Central, and West Africa and from China (bootstrap >90%). The isolates from these regions were divided into 2 subclades: I and II (Figure 4, panel A). Subclade I comprised a mix of P. malariae isolates from Kenya, Cameroon, and Côte d’Ivoire. Subclade II comprised a mix of P. malariae isolates from Kenya, Cameroon, Uganda, and China. Sequences without the central repeat region indicated consistently the distinctiveness between P. brasilianum from Brazil and P. malariae, but the P. malariae samples from different geographic regions were poorly resolved (Figure 4, panel B). The P. malariae isolate from China was nested within the African subclade, suggestive of an African origin (Figure 4, panel C). No clear microgeographic structure was detected, although sample size at the population level was small.
Figure 5
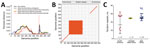
Figure 5. Comparison of circumsporozoite protein (csp) gene sequence divergence among Plasmodium isolates from different geographic regions. A) Pairwise genetic distance plot of all amino acid positions of the csp gene. The matrix-normalized...
Among the 3 geographic regions, the level of csp sequence divergence in P. malariae was higher in isolates from East Africa than from West Africa, as reflected by a higher number of polymorphic sites and a greater extent of csp length variation despite difference in sample size (Figure 5, panels A and B). These variations were located at the 3′ N terminal through the central repeat region, where the largest degree of mismatch was observed (Figure 5, panel B). To the contrary, the level of sequence polymorphism was lowest in isolates from South America (Figure 5, panel A), but the greatest range of difference in tandem repeat units where remarkable mismatch was observed was toward the end of the central region. Despite the small sample size, the number of tandem repeats was generally lower in P. brasilianum than P. malariae (Figure 5, panel C).
In Kenya, areas along the shoreline of Lake Victoria and coastal regions are malaria hot spots, where intense and stable plasmodia transmission occurs throughout the year (31). For achieving the ultimate goal of eliminating malaria in Kenya, existing control programs that primarily target P. falciparum are inadequate. The use of rapid diagnostic tests or microscopy as first-line diagnostic methods can lead to gross underestimation of the actual prevalence of P. malariae (4–6). Our findings indicated that P. malariae accounted for ≈3% of clinical cases and ≈5% of asymptomatic infections in this malaria-endemic region. The prevalence of asymptomatic P. malariae infections was comparable to that recently reported for nearby islands of Lake Victoria (1.7%–3.96%) on the basis of PCR (36,37). These asymptomatic P. malariae infections are concerning because they are parasite reservoirs that can sustain long-term transmission. For instance, in the Colombian Amazon region, P. malariae was thought to account for <1% of all malaria infections (38,39); however, a recent study revealed that 43.6% (294/675) of clinical cases were caused by P. malariae (10) and suggested that these parasites have been circulating in the community undetected. Underestimation or lack of awareness of its occurrence could thus lead to increased transmission. The infectiousness of P. malariae for Anopheles mosquitoes in malaria-endemic areas remains unclear and merits further investigation.
We found that P. malariae infections were more common among infants and children than adults. A similar pattern has been found for Senegal, West Africa, where 91% (265/290 cases) of clinical P. malariae cases occurred in children <15 years of age and the mean incidence density was highest for those 5–9 years of age (3). These findings indicate that children are vulnerable to P. malariae infection and contrast with those reported for Papua, Indonesia, where P. malariae infection was higher among older (median 21 years of age) than younger persons (9). It is possible that our study sites in western Kenya, as well as in West Africa, are high-transmission areas where P. falciparum malaria prevalence can be ≈60% during the rainy season (30,40). Cumulative exposure to the parasites over time may enable gradual acquisition of immunity in adults. Nevertheless, our community samples were mostly obtained from schoolchildren 6–15 years of age. Underrepresentation of adult populations may underestimate the overall malaria prevalence in the study area. Although young children are more vulnerable to P. malariae infections, the level of P. malariae parasitemia does not seem to be associated with age. Chronic nephrotic syndromes attributed to P. malariae have been reported (41,42) and shown to be associated with significant illness from anemia in young children (8,9). However, the lack of hematologic data from our study participants limits further investigation.
Our data indicate that ≈50% of P. malariae–positive samples detected by PCR were undetected by microscopy. Such a low sensitivity of microscopy could be attributed to a significantly lower P. malariae than P. falciparum parasitemia, according to qPCRs. Because most P. malariae–positive samples had mixed infections, microscopists could have recorded only the dominant P. falciparum and overlooked the sparse P. malariae trophozoites. Also, the ring forms of P. falciparum and P. malariae are morphologically more similar to each other than to P. vivax and P. ovale (43). Misdiagnosis of parasite species by microscopy is possible (8).
In Africa, the standard treatment for P. malariae monoinfection is chloroquine, and for P. falciparum and mixed plasmodial infections it is artemisinin combination therapy (31). The combination treatment regime should cure P. malariae infections even in cases of misdiagnosis. However, P. malariae increases production of P. falciparum gametocytes in mixed infections, and these gametocytes can persist without proper antimalarial treatment or monitoring (44). Therefore, we highlight the need for sensitive methods to improve P. malariae diagnosis and provide accurate epidemiologic data for specific and effective management guidelines. Although PCR is a better diagnostic method, it uses a relatively small amount of blood from filter papers and could still underestimate P. malariae infections in samples with exceptionally low levels of parasitemia. More accurate prevalence data may be obtained from ultrasensitive PCR that targets multicopy regions of the parasite genome (45) or reverse transcription PCR of parasite RNA extracted from whole blood (46).
Sequences of the csp gene were shown to be highly polymorphic among P. malariae isolates from western Kenya. The most polymorphic region was in the central repeat region, where mutations and length differences were detected (24,28). Among the isolates from different geographic areas, P. malariae from East and Central/West Africa were genetically closely related and exhibited a comparable level of sequence variation. This variation could be attributed to positive selection, frequent recombination, and gene flow among the parasites, as follows. First, compared with msp1, dhfr, and dhps of P. malariae (20–22), the csp gene revealed a remarkably higher level of sequence diversity. It is possible that selection of csp genetic variants may confer immunogenic advantages to the pathogen during host invasion (28,47). Second, intense transmission and large vector populations in our study area might enhance frequent heterologous recombination of the parasite genome during reproduction in the mosquitoes and increase genetic diversity within populations (24,25). Third, recurrent gene flow between the parasite populations across countries, via human migration or dispersal of vector mosquitoes, promotes the spread of these genetic variants, leading to a lack of differentiation according to geographic region. Future study using other variable markers, such as microsatellites, on expanded population samples could validate our findings.
In summary, underestimation of the actual prevalence of asymptomatic infections hinders progress toward malaria elimination in Africa. The low parasitemia of P. malariae infections influences diagnostic sensitivity by microscopy. A more sensitive tool is needed to identify asymptomatic P. malariae and to improve control strategies, particularly among infants and children who are vulnerable to P. malariae infection.
Dr. Lo is a researcher focused on molecular epidemiology and evolution of pathogens. She is interested in exploring the effects of host–parasite interactions on parasite genomic and genetic structure.
Acknowledgments
We are greatly indebted to technicians and staff from the Kenya Medical Research Institute for sample collection, undergraduate students for assisting with data collection, and Ming-Chieh Lee for producing the map of the study area.
This research was supported by US National Institutes of Health grants R01 AI050243 and D43 TW001505 to G.Y.
References
- Alonso PL, Tanner M. Public health challenges and prospects for malaria control and elimination. Nat Med. 2013;19:150–5. DOIPubMedGoogle Scholar
- Tanner M, Greenwood B, Whitty CJM, Ansah EK, Price RN, Dondorp AM, et al. Malaria eradication and elimination: views on how to translate a vision into reality. BMC Med. 2015;13:167. DOIPubMedGoogle Scholar
- Roucher C, Rogier C, Sokhna C, Tall A, Trape JF. A 20-year longitudinal study of Plasmodium ovale and Plasmodium malariae prevalence and morbidity in a West African population. PLoS One. 2014;9:e87169. DOIPubMedGoogle Scholar
- Farcas GA, Zhong KJY, Lovegrove FE, Graham CM, Kain KC. Evaluation of the Binax NOW ICT test versus polymerase chain reaction and microscopy for the detection of malaria in returned travelers. Am J Trop Med Hyg. 2003;69:589–92.PubMedGoogle Scholar
- Nkrumah B, Acquah SE, Ibrahim L, May J, Brattig N, Tannich E, et al. Comparative evaluation of two rapid field tests for malaria diagnosis: Partec Rapid Malaria Test® and Binax Now® Malaria Rapid Diagnostic Test. BMC Infect Dis. 2011;11:143. DOIPubMedGoogle Scholar
- Niño CH, Cubides JR, Camargo-Ayala PA, Rodríguez-Celis CA, Quiñones T, Cortés-Castillo MT, et al. Plasmodium malariae in the Colombian Amazon region: you don’t diagnose what you don’t suspect. Malar J. 2016;15:576. DOIPubMedGoogle Scholar
- Vinetz JM, Li J, McCutchan TF, Kaslow DC. Plasmodium malariae infection in an asymptomatic 74-year-old Greek woman with splenomegaly. N Engl J Med. 1998;338:367–71. DOIPubMedGoogle Scholar
- Douglas NM, Lampah DA, Kenangalem E, Simpson JA, Poespoprodjo JR, Sugiarto P, et al. Major burden of severe anemia from non-falciparum malaria species in southern Papua: a hospital-based surveillance study. PLoS Med. 2013;10:e1001575, discussion e1001575.
- Langford S, Douglas NM, Lampah DA, Simpson JA, Kenangalem E, Sugiarto P, et al. Plasmodium malariae infection associated with a high burden of anemia: a hospital-based surveillance study. PLoS Negl Trop Dis. 2015;9:e0004195. DOIPubMedGoogle Scholar
- Camargo-Ayala PA, Cubides JR, Niño CH, Camargo M, Rodríguez-Celis CA, Quiñones T, et al. High Plasmodium malariae prevalence in an endemic area of the Colombian Amazon Region. PLoS One. 2016;11:e0159968. DOIPubMedGoogle Scholar
- Naqvi R, Ahmad E, Akhtar F, Naqvi A, Rizvi A. Outcome in severe acute renal failure associated with malaria. Nephrol Dial Transplant. 2003;18:1820–3. DOIPubMedGoogle Scholar
- Okiro EA, Al-Taiar A, Reyburn H, Idro R, Berkley JA, Snow RW. Age patterns of severe paediatric malaria and their relationship to Plasmodium falciparum transmission intensity. Malar J. 2009;8:4. DOIPubMedGoogle Scholar
- Carneiro I, Roca-Feltrer A, Griffin JT, Smith L, Tanner M, Schellenberg JA, et al. Age-patterns of malaria vary with severity, transmission intensity and seasonality in sub-Saharan Africa: a systematic review and pooled analysis. PLoS One. 2010;5:e8988. DOIPubMedGoogle Scholar
- Roca-Feltrer A, Carneiro I, Smith L, Schellenberg JRMA, Greenwood B, Schellenberg D. The age patterns of severe malaria syndromes in sub-Saharan Africa across a range of transmission intensities and seasonality settings. Malar J. 2010;9:282. DOIPubMedGoogle Scholar
- Scopel KKG, Fontes CJF, Nunes ÁC, Horta MF, Braga ÉM. High prevalence of Plamodium malariae infections in a Brazilian Amazon endemic area (Apiacás-Mato Grosso State) as detected by polymerase chain reaction. Acta Trop. 2004;90:61–4. DOIPubMedGoogle Scholar
- Zhou M, Liu Q, Wongsrichanalai C, Suwonkerd W, Panart K, Prajakwong S, et al. High prevalence of Plasmodium malariae and Plasmodium ovale in malaria patients along the Thai-Myanmar border, as revealed by acridine orange staining and PCR-based diagnoses. Trop Med Int Health. 1998;3:304–12. DOIPubMedGoogle Scholar
- Mohapatra PK, Prakash A, Bhattacharyya DR, Goswami BK, Ahmed A, Sarmah B, et al. Detection & molecular confirmation of a focus of Plasmodium malariae in Arunachal Pradesh, India. Indian J Med Res. 2008;128:52–6.PubMedGoogle Scholar
- Kaneko A, Taleo G, Kalkoa M, Yaviong J, Reeve PA, Ganczakowski M, et al. Malaria epidemiology, glucose 6-phosphate dehydrogenase deficiency and human settlement in the Vanuatu Archipelago. Acta Trop. 1998;70:285–302. DOIPubMedGoogle Scholar
- Mueller I, Tulloch J, Marfurt J, Hide R, Reeder JC. Malaria control in Papua New Guinea results in complex epidemiological changes. P N G Med J. 2005;48:151–7.PubMedGoogle Scholar
- Guimarães LO, Wunderlich G, Alves JMP, Bueno MG, Röhe F, Catão-Dias JL, et al. Merozoite surface protein-1 genetic diversity in Plasmodium malariae and Plasmodium brasilianum from Brazil. BMC Infect Dis. 2015;15:529. DOIPubMedGoogle Scholar
- Tanomsing N, Imwong M, Pukrittayakamee S, Chotivanich K, Looareesuwan S, Mayxay M, et al. Genetic analysis of the dihydrofolate reductase-thymidylate synthase gene from geographically diverse isolates of Plasmodium malariae. Antimicrob Agents Chemother. 2007;51:3523–30. DOIPubMedGoogle Scholar
- Tanomsing N, Mayxay M, Newton PN, Nosten F, Dolecek C, Hien TT, et al. Genetic variability of Plasmodium malariae dihydropteroate synthase (dhps) in four Asian countries. PLoS One. 2014;9:e93942. DOIPubMedGoogle Scholar
- Sultan AA. Molecular mechanisms of malaria sporozoite motility and invasion of host cells. Int Microbiol. 1999;2:155–60.PubMedGoogle Scholar
- McCutchan TF, Lal AA, do Rosario V, Waters AP. Two types of sequence polymorphism in the circumsporozoite gene of Plasmodium falciparum. Mol Biochem Parasitol. 1992;50:37–45. DOIPubMedGoogle Scholar
- Escalante AA, Grebert HM, Isea R, Goldman IF, Basco L, Magris M, et al. A study of genetic diversity in the gene encoding the circumsporozoite protein (CSP) of Plasmodium falciparum from different transmission areas—XVI. Asembo Bay Cohort Project. Mol Biochem Parasitol. 2002;125:83–90. DOIPubMedGoogle Scholar
- Zakeri S, Abouie Mehrizi A, Djadid ND, Snounou G. Circumsporozoite protein gene diversity among temperate and tropical Plasmodium vivax isolates from Iran. Trop Med Int Health. 2006;11:729–37. DOIPubMedGoogle Scholar
- Parobek CM, Bailey JA, Hathaway NJ, Socheat D, Rogers WO, Juliano JJ. Differing patterns of selection and geospatial genetic diversity within two leading Plasmodium vivax candidate vaccine antigens. PLoS Negl Trop Dis. 2014;8:e2796. DOIPubMedGoogle Scholar
- Tahar R, Ringwald P, Basco LK. Heterogeneity in the circumsporozoite protein gene of Plasmodium malariae isolates from sub-Saharan Africa. Mol Biochem Parasitol. 1998;92:71–8. DOIPubMedGoogle Scholar
- Zeeshan M, Alam MT, Vinayak S, Bora H, Tyagi RK, Alam MS, et al. Genetic variation in the Plasmodium falciparum circumsporozoite protein in India and its relevance to RTS,S malaria vaccine. PLoS One. 2012;7:e43430. DOIPubMedGoogle Scholar
- Lo E, Zhou G, Oo W, Afrane Y, Githeko A, Yan G. Low parasitemia in submicroscopic infections significantly impacts malaria diagnostic sensitivity in the highlands of Western Kenya. PLoS One. 2015;10:e0121763. DOIPubMedGoogle Scholar
- National Malaria Control Programme, Kenya National Bureau of Statistics, Ministry of Health, Kenya. Malaria indicator survey 2015. Nairobi (Kenya): The Ministry; 2015.
- Wooden J, Kyes S, Sibley CH. PCR and strain identification in Plasmodium falciparum. Parasitol Today. 1993;9:303–5. DOIPubMedGoogle Scholar
- Kimura K, Kaneko O, Liu Q, Zhou M, Kawamoto F, Wataya Y, et al. Identification of the four species of human malaria parasites by nested PCR that targets variant sequences in the small subunit rRNA gene. Parasitol Int. 1997;46:91–5. DOIGoogle Scholar
- Lo E, Nguyen J, Oo W, Hemming-Schroeder E, Zhou G, Yang Z, et al. Examining Plasmodium falciparum and P. vivax clearance subsequent to antimalarial drug treatment in the Myanmar-China border area based on quantitative real-time polymerase chain reaction. BMC Infect Dis. 2016;16:154–66. DOIPubMedGoogle Scholar
- Phuong M, Lau R, Ralevski F, Boggild AK. Sequence-based optimization of a quantitative real-time PCR assay for detection of Plasmodium ovale and Plasmodium malariae. J Clin Microbiol. 2014;52:1068–73. DOIPubMedGoogle Scholar
- Olanga EA, Okombo L, Irungu LW, Mukabana WR. Parasites and vectors of malaria on Rusinga Island, western Kenya. Parasit Vectors. 2015;8:250. DOIPubMedGoogle Scholar
- Idris ZM, Chan CW, Kongere J, Gitaka J, Logedi J, Omar A, et al. High and heterogeneous prevalence of asymptomatic and sub-microscopic malaria infections on islands in Lake Victoria, Kenya. Sci Rep. 2016;6:36958. DOIPubMedGoogle Scholar
- Rodríguez JC, Uribe GA, Araújo RM, Narváez PC, Valencia SH. Epidemiology and control of malaria in Colombia. Mem Inst Oswaldo Cruz. 2011;106(Suppl 1):114–22. DOIPubMedGoogle Scholar
- Githeko AK, Ayisi JM, Odada PK, Atieli FK, Ndenga BA, Githure JI, et al. Topography and malaria transmission heterogeneity in western Kenya highlands: prospects for focal vector control. Malar J. 2006;5:107. DOIPubMedGoogle Scholar
- Ehrich JHH, Eke FU. Malaria-induced renal damage: facts and myths. Pediatr Nephrol. 2007;22:626–37. DOIPubMedGoogle Scholar
- Hedelius R, Fletcher JJ, Glass WF II, Susanti AI, Maguire JD. Nephrotic syndrome and unrecognized Plasmodium malariae infection in a US Navy sailor 14 years after departing Nigeria. J Travel Med. 2011;18:288–91. DOIPubMedGoogle Scholar
- Collins WE, Jeffery GM. Plasmodium malariae: parasite and disease. Clin Microbiol Rev. 2007;20:579–92. DOIPubMedGoogle Scholar
- Bousema JT, Drakeley CJ, Mens PF, Arens T, Houben R, Omar SA, et al. Increased Plasmodium falciparum gametocyte production in mixed infections with P. malariae. Am J Trop Med Hyg. 2008;78:442–8.PubMedGoogle Scholar
- Hofmann N, Mwingira F, Shekalaghe S, Robinson LJ, Mueller I, Felger I. Ultra-sensitive detection of Plasmodium falciparum by amplification of multi-copy subtelomeric targets. PLoS Med. 2015;12:e1001788. DOIPubMedGoogle Scholar
- Adams M, Joshi SN, Mbambo G, Mu AZ, Roemmich SM, Shrestha B, et al. An ultrasensitive reverse transcription polymerase chain reaction assay to detect asymptomatic low-density Plasmodium falciparum and Plasmodium vivax infections in small volume blood samples. Malar J. 2015;14:520. DOIPubMedGoogle Scholar
- Casares S, Brumeanu TD, Richie TL. The RTS,S malaria vaccine. Vaccine. 2010;28:4880–94. DOIPubMedGoogle Scholar
Figures
Tables
Cite This ArticleTable of Contents – Volume 23, Number 4—April 2017
| EID Search Options |
|---|
|
|
|
|
|
|
Please use the form below to submit correspondence to the authors or contact them at the following address:
Eugenia Lo and Guiyun Yan, Program in Public Health, Rm 3501B, Hewitt Hall, Health Science Dr, University of California Irvine, Irvine, CA 92617, USA; and
Top