Volume 23, Number 5—May 2017
Dispatch
Estimated Incubation Period for Zika Virus Disease
Figure 1
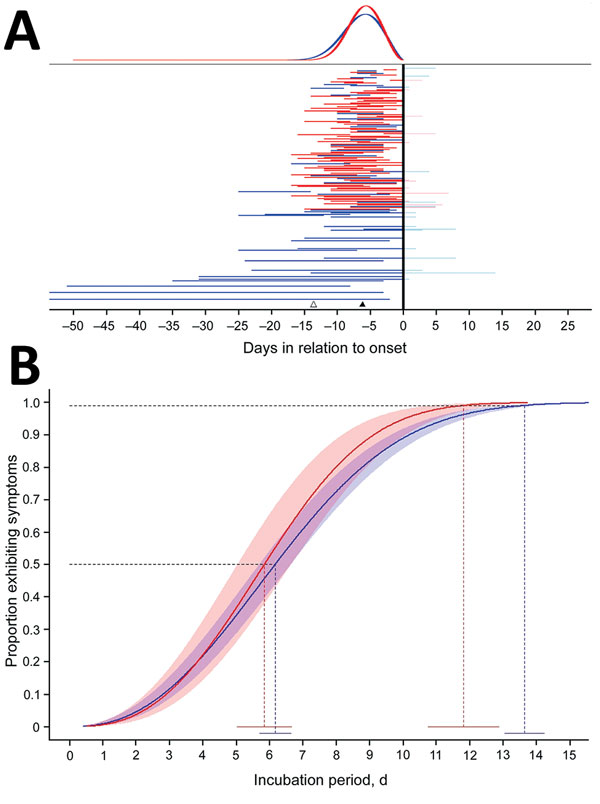
Figure 1. Estimated distribution of incubation period in days since infection for persons with evidence of recent Zika virus disease. A) Representation of individual interval censored travel data based on time of exposure relative to symptom onset (n = 197). Horizontal lines represent exposure times relative to onset. Vertical black line indicates symptom onset; red indicates persons with confirmed Zika virus disease; blue indicates all persons with Zika virus diseases; pink indicates exposure durations after symptom onset; and light blue indicates that these times did not contribute to the analysis. Individual data are sorted from bottom to top by exposure duration; to ease visible interpretation, we truncated long durations. The black triangle marks the estimated median incubation period for all Zika virus disease cases; the white triangle marks the estimated 95th quantile. The top panel shows the fitted Weibull density function; the blue line represents the distribution for all Zika virus disease cases; and the red line represents only those with confirmed Zika virus disease. B) Estimated distribution of time from infection to symptom onset (incubation period) for 197 persons with evidence of recent Zika virus infection (blue) and with confirmed Zika virus disease (red). The heavy line represents the estimated Weibull cumulative distribution function for the incubation period; 95% confidence bands are shown in red and blue shading. The 2 dotted lines represent the 50th and 99th quantiles; blue represents all cases; and red represents confirmed cases only. The solid horizontal line near the x-axis gives the point estimates and 95% CIs for the quantiles. Additional quantiles and CIs are shown in Technical Appendix Table 2).