Skip directly to site content Skip directly to page options Skip directly to A-Z link Skip directly to A-Z link Skip directly to A-Z link
Volume 24, Number 10—October 2018
Research

Transmission Dynamics of Highly Pathogenic Avian Influenza Virus A(H5Nx) Clade 2.3.4.4, North America, 2014–2015

Dong-Hun Lee1, Mia Kim Torchetti, Joseph Hicks, Mary Lea Killian, Justin Bahl, Mary Pantin-Jackwood, and David E. SwayneComments to Author 
Author affiliations: US Department of Agriculture, Athens, Georgia, USA (D.-H. Lee, M. Pantin-Jackwood, D.E. Swayne); US Department of Agriculture, Ames, Iowa, USA (M.K. Torchetti, M.L. Killian); University of Texas School of Public Health, Houston, Texas, USA (J. Hicks, J. Bahl)

Main Article

Figure 3

Phylogeographic reconstruction of source–sink dynamics of highly pathogenic avian influenza virus A(H5N2) outbreak, United States, 2014–2015. A) Phylogenetic tree of hemagglutinin gene of H5N2 isolates. The geographic region and host type were defined in the model as discrete nominal character states, and the number of state transitions at tree nodes was counted. The character states included in the phylogenetic model (Midwest chicken, Midwest turkey, Midwest wild bird, Pacific chicken, Pacific

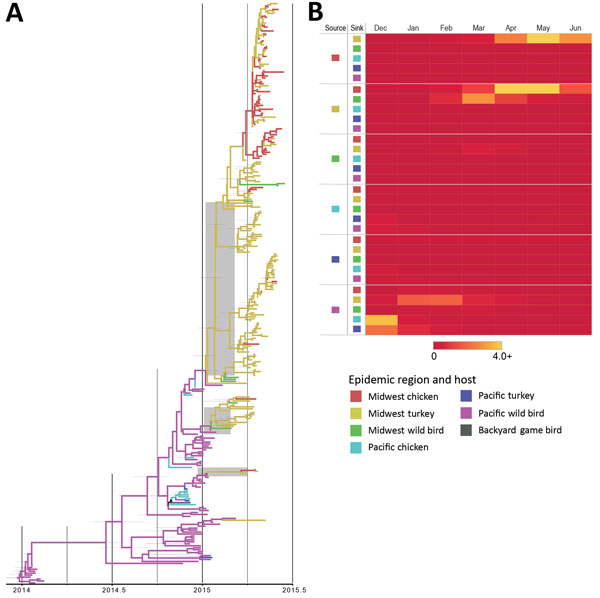
Figure 3. Phylogeographic reconstruction of source–sink dynamics of highly pathogenic avian influenza virus A(H5N2) outbreak, United States, 2014–2015. A) Phylogenetic tree of hemagglutinin gene of H5N2 isolates. The geographic region and host type were defined in the model as discrete nominal character states, and the number of state transitions at tree nodes was counted. The character states included in the phylogenetic model (Midwest chicken, Midwest turkey, Midwest wild bird, Pacific chicken, Pacific turkey, and Pacific wild bird) are indicated. Black nodes and branches represent an ancestral reconstruction that is highly uncertain, sharing equal probability between Pacific wild bird and Pacific turkey. The shaded boxes represent the time between the introduction of the virus into Midwest poultry populations and the first detection of the virus within the population. B) Heat map showing source–sink dynamics and average number of transitions per location per year (0–4.0).

Main Article

1Current affiliation: University of Connecticut, Storrs, Connecticut, USA.

Page created: September 14, 2018
Page updated: September 14, 2018
Page reviewed: September 14, 2018
The conclusions, findings, and opinions expressed by authors contributing to this journal do not necessarily reflect the official position of the U.S. Department of Health and Human Services, the Public Health Service, the Centers for Disease Control and Prevention, or the authors' affiliated institutions. Use of trade names is for identification only and does not imply endorsement by any of the groups named above.
file_external