Volume 24, Number 12—December 2018
Synopsis
Restaurant Inspection Letter Grades and Salmonella Infections, New York, New York, USA
Melanie J. Firestone and Craig W. Hedberg
Figure
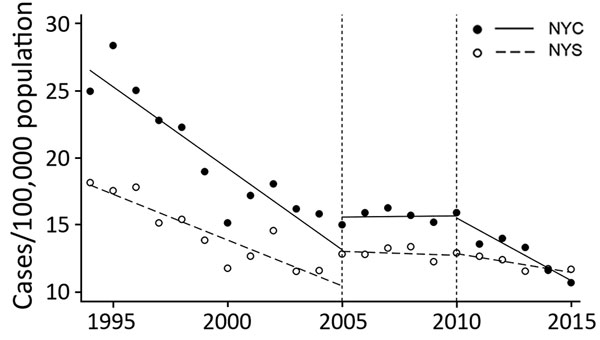
Figure. Confirmed Salmonella infection cases per 100,000 population in NYC and the rest of the state, 1994–2015. Dashed lines indicate implementation of point scores in 2005 and letter grades in 2010. NYC, New York City; NYS, rest of state.
Page created: November 20, 2018
Page updated: November 20, 2018
Page reviewed: November 20, 2018
The conclusions, findings, and opinions expressed by authors contributing to this journal do not necessarily reflect the official position of the U.S. Department of Health and Human Services, the Public Health Service, the Centers for Disease Control and Prevention, or the authors' affiliated institutions. Use of trade names is for identification only and does not imply endorsement by any of the groups named above.