Novel Type of Chronic Wasting Disease Detected in Moose (Alces alces), Norway
Laura Pirisinu, Linh Tran, Barbara Chiappini, Ilaria Vanni, Michele A. Di Bari, Gabriele Vaccari, Turid Vikøren, Knut Ivar Madslien, Jørn Våge, Terry Spraker, Gordon Mitchell, Aru Balachandran, Thierry Baron, Cristina Casalone, Christer M. Rolandsen, Knut H. Røed, Umberto Agrimi, Romolo Nonno, and Sylvie L. Benestad

Author affiliations: Istituto Superiore di Sanità, Rome, Italy (L. Pirisinu, B. Chiappini, I. Vanni, M.A. Di Bari, G. Vaccari, U. Agrimi, R. Nonno); Norwegian Veterinary Institute, Oslo, Norway (L. Tran, T. Vikøren, K.I. Madslien, J. Våge, S.L. Benestad); Colorado State University, Fort Collins, Colorado, USA (T. Spraker); Canadian Food Inspection Agency, Ottawa, Ontario, Canada (G. Mitchell, A. Balachandran); Anses Lyon Unité “Maladies Neuro-Dégénératives,” Lyon, France (T. Baron); Istituto Zooprofilattico Sperimentale del Piemonte Liguria e Valle d’Aosta, Torino, Italy (C. Casalone); Norwegian Institute for Nature Research, Trondheim, Norway (C.M. Rolandsen); Norwegian University of Life Sciences, Faculty of Veterinary Science, Oslo (K.H. Røed)
Main Article
Figure 4
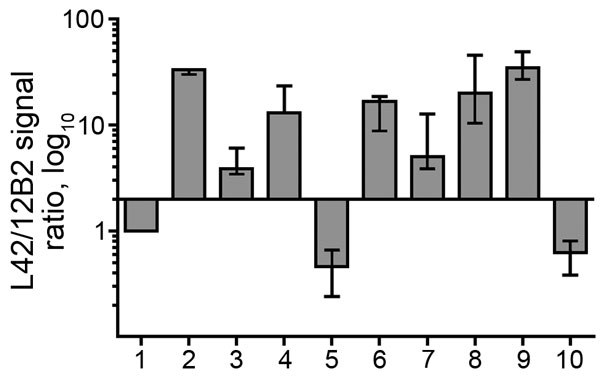
Figure 4. Bar graph of antibody-signal ratios (y-axis) showing discrimination of the ovine, bovine, moose, and reindeer samples (x-axis) analyzed in a study characterizing chronic wasting disease in moose (Alces alces), Norway. Numbers indicate sample type: 1, scrapie; 2, CH1641; 3, CH1641-like; 4, classical bovine spongiform encephalopathy (BSE); 5, H-type atypical BSE; 6, L-type atypical BSE; 7, moose no. 1; 8, moose no. 2; 9, moose no. 3; 10, reindeer. The antibody ratio is the L42/12B2 ratio of the chemiluminescence signal relative to the L42/12B2 ratio of the control scrapie loaded in each blot. Bars represent median values of >3 independent determinations; error bars represent the range of observed values. Bars start at y = 2, which is the cutoff value of the antibody ratio for the discrimination of low molecular weight samples (i.e., suspected bovine spongiform encephalopathy cases) from scrapie, according to discriminatory Western blot.
Main Article
Page created: November 20, 2018
Page updated: November 20, 2018
Page reviewed: November 20, 2018
The conclusions, findings, and opinions expressed by authors contributing to this journal do not necessarily reflect the official position of the U.S. Department of Health and Human Services, the Public Health Service, the Centers for Disease Control and Prevention, or the authors' affiliated institutions. Use of trade names is for identification only and does not imply endorsement by any of the groups named above.