Volume 24, Number 4—April 2018
Research
Emerging Coxsackievirus A6 Causing Hand, Foot and Mouth Disease, Vietnam
Nguyen To Anh, Le Nguyen Truc Nhu, Hoang Minh Tu Van, Nguyen Thi Thu Hong, Tran Tan Thanh, Vu Thi Ty Hang, Nguyen Thi Han Ny, Lam Anh Nguyet, Tran Thi Lan Phuong, Le Nguyen Thanh Nhan, Nguyen Thanh Hung, Truong Huu Khanh, Ha Manh Tuan, Ho Lu Viet, Nguyen Tran Nam, Do Chau Viet, Phan Tu Qui, Bridget Wills, Sarawathy Sabanathan, Nguyen Van Vinh Chau, Louise Thwaites, H. Rogier van Doorn, Guy Thwaites, Maia A. Rabaa, and Le Van Tan
Figure 3
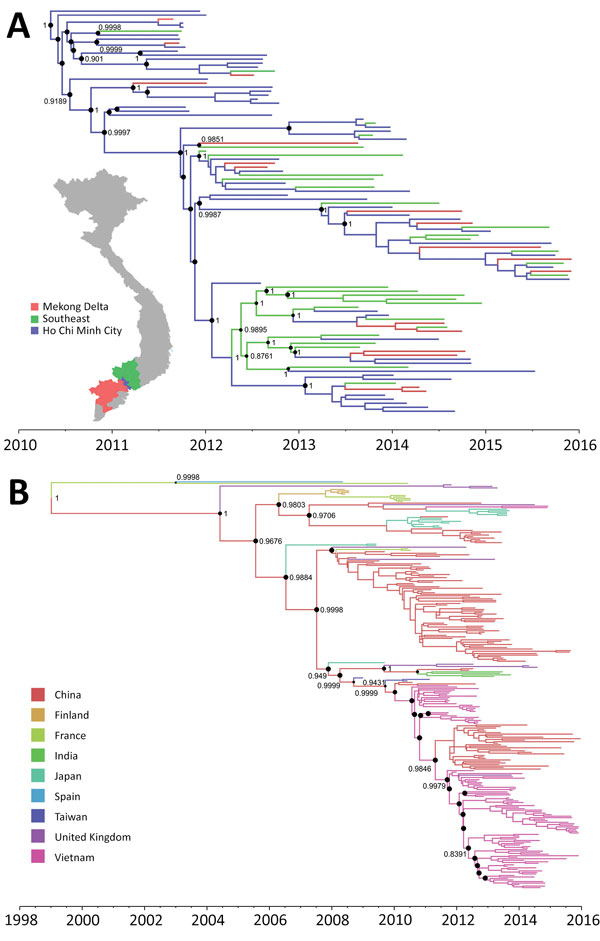
Figure 3. Maximum clade credibility trees illustrating the phylogeography of coxsackievirus A6. A) Complete coding sequence–based tree of Vietnam strains; B) viral capsid protein 1–based tree of global strains. Branches are color-coded according to location of sampling. Posterior probabilities >85% and state probabilities >75% (black circles) are indicated at all nodes. Map in panel A obtained from https://mapchart.net.
Page created: March 16, 2018
Page updated: March 16, 2018
Page reviewed: March 16, 2018
The conclusions, findings, and opinions expressed by authors contributing to this journal do not necessarily reflect the official position of the U.S. Department of Health and Human Services, the Public Health Service, the Centers for Disease Control and Prevention, or the authors' affiliated institutions. Use of trade names is for identification only and does not imply endorsement by any of the groups named above.