Bioclinical Test to Predict Nephropathia Epidemica Severity at Hospital Admission
Maxime Hentzien

, Stéphanie Mestrallet, Pascale Halin, Laure-Anne Pannet, Delphine Lebrun, Moustapha Dramé, Firouzé Bani-Sadr, Jean-Marc Galempoix, Christophe Strady, Jean-Marc Reynes, Christian Penalba, and Amélie Servettaz
Author affiliations: University of Reims Champagne-Ardenne, Reims, France (M. Hentzien, M. Dramé); Hôpital Universitaire Robert Debré, Reims (M. Hentzien, M. Dramé, F. Bani-Sadr, A. Servettaz); Manchester Hospital, Charleville-Mézières, France (S. Mestrallet, P. Halin, L.-A. Pannet, D. Lebrun, J.-M. Galempoix, C. Penalba); Groupe Courlancy, Reims (C. Strady); Institut Pasteur, Lyon, France (J.-M. Reynes)
Main Article
Figure 2
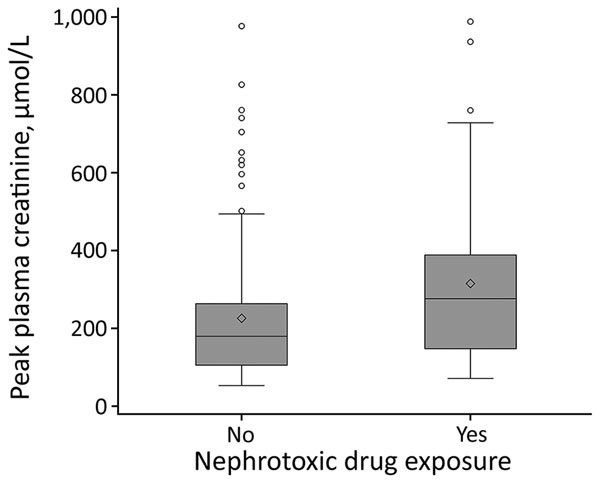
Figure 2. Peak creatinine plasma levels in patients hospitalized for nephropathia epidemica by nephrotoxic drug exposure, Ardennes Department, France, January 2000–December 2014. Top and bottom borders of boxes indicate interquartile ranges (IQRs), horizontal lines within boxes indicate medians, diamonds indicate means, and circles represent outliers. A whisker is drawn from the upper edge of the box to the largest observed value within the upper fence (located at 1.5 × IQR above the 75th percentile), and another is drawn from the lower edge of the box to the smallest observed value within the lower fence (located at 1.5 × IQR below the 25th percentile). Peak plasma creatinine levels were higher in the patients exposed to nephrotoxic drugs (p = 0.002).
Main Article
Page created: May 15, 2018
Page updated: May 15, 2018
Page reviewed: May 15, 2018
The conclusions, findings, and opinions expressed by authors contributing to this journal do not necessarily reflect the official position of the U.S. Department of Health and Human Services, the Public Health Service, the Centers for Disease Control and Prevention, or the authors' affiliated institutions. Use of trade names is for identification only and does not imply endorsement by any of the groups named above.