Diversity of Influenza A(H5N1) Viruses in Infected Humans, Northern Vietnam, 2004–2010
Hirotaka Imai
1, Jorge M. Dinis
1, Gongxun Zhong, Louise H. Moncla, Tiago J.S. Lopes, Ryan McBride, Andrew J. Thompson, Wenjie Peng, Mai thi Q. Le, Anthony Hanson, Michael Lauck, Yuko Sakai-Tagawa, Shinya Yamada, Julie Eggenberger, David H. O’Connor, Yasuo Suzuki, Masato Hatta, James C. Paulson, Gabriele Neumann, and Yoshihiro Kawaoka

Author affiliations: University of Wisconsin, Madison, Wisconsin, USA (H. Imai, J.M. Dinis, G. Zhong, L.H. Moncla, T.J.S. Lopes, A. Hanson, M. Lauck, J. Eggenberger, D.H. O’Connor, M. Hatta, G. Neumann, T.C. Friedrich, Y. Kawaoka); The Scripps Research Institute, La Jolla, California, USA (R. McBride, A.J. Thompson, W. Peng, J.C. Paulson); National Institute of Hygiene and Epidemiology, Hanoi, Vietnam (M.t.Q. Le); University of Tokyo, Tokyo, Japan (Y. Sakai-Tagawa, S. Yamada, Y. Kawaoka); Chubu University, Kasugai, Japan (Y. Suzuki)
Main Article
Figure 3
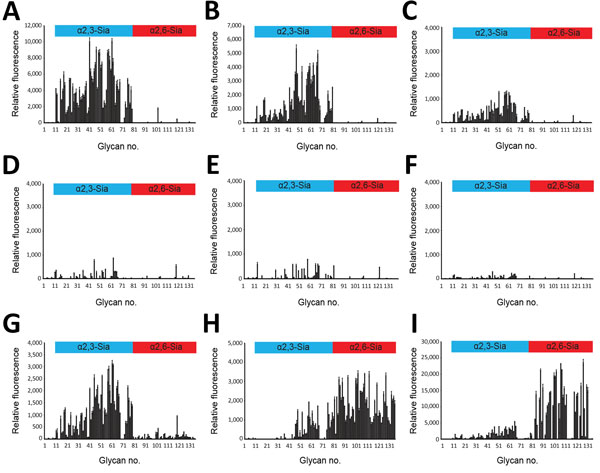
Figure 3. Glycan microarray analysis of selected influenza A(H5N1) virus isolates from humans, northern Vietnam, 2004–2010. The labeled viruses were applied to a microarray that included α2,3-linked (blue) and α2,6-linked (red) glycans, which are indicated by numbers on the x-axis (online Technical Appendix Figure 1, https://wwwnc.cdc.gov/EID/article/24/7/17-1441-Techapp1.pdf). Shown are the binding signals with error bars reflecting SEMs calculated from 4 of 6 replicates on the array after discarding the highest and lowest signals; note that the scales on the y-axis (relative fluorescence) vary because of differences in binding strength: A) CA04/UT3040I/II-HA; B) CA04/UT3040I-HA-138V; C) CA04/UT3040II-HA-186K; D) CA04/UT36250I/II-HA; E) CA04/UT36250I/II-HA-138V; F) CA04/UT36282I/II-HA; G) CA04/UT36282I/II-HA-138V/A; H) CA04/K173; I) Brisbane/10/2007.
Main Article
Page created: June 18, 2018
Page updated: June 18, 2018
Page reviewed: June 18, 2018
The conclusions, findings, and opinions expressed by authors contributing to this journal do not necessarily reflect the official position of the U.S. Department of Health and Human Services, the Public Health Service, the Centers for Disease Control and Prevention, or the authors' affiliated institutions. Use of trade names is for identification only and does not imply endorsement by any of the groups named above.