Skip directly to site content Skip directly to page options Skip directly to A-Z link Skip directly to A-Z link Skip directly to A-Z link
Volume 24, Number 8—August 2018
Research

Human Norovirus Replication in Human Intestinal Enteroids as Model to Evaluate Virus Inactivation

Veronica CostantiniComments to Author , Esther K. Morantz, Hannah Browne, Khalil Ettayebi, Xi-Lei Zeng, Robert L. Atmar, Mary K. Estes, and Jan Vinjé
Author affiliations: Centers for Disease Control and Prevention, Atlanta, Georgia, USA (V. Costantini, J. Vinjé); Synergy America, Inc., Atlanta (E.K. Morantz); Oak Ridge Institute for Science and Education, Oak Ridge, Tennessee, USA (H. Browne); Baylor College of Medicine, Houston, Texas, USA (K. Ettayebi, X.-L. Zeng, R.L. Atmar, M.K. Estes)

Main Article

Figure 5

Confirmatory testing for human norovirus replication in human intestinal enteroids (HIEs). We inoculated jejunal HIE monolayers (J3 line) with A) GII.4 Pe-GII.4 Sydney (3.3 × 10⁵ RNA copies/well), B) GII.P12-GII.3 (5.3 × 10⁵ RNA copies/well), C) GII.P16-GII.2 (3.2 × 10⁵ RNA copies/well), or D) GII.Pg-GII.1 (9.3 × 10⁵ RNA copies/well). After 1 h at 37°C in 5% CO2, monolayers were washed, and media was replaced with differentiation media and incubated at 37°C and 5% CO2. At 24, 48, and 72 hours po

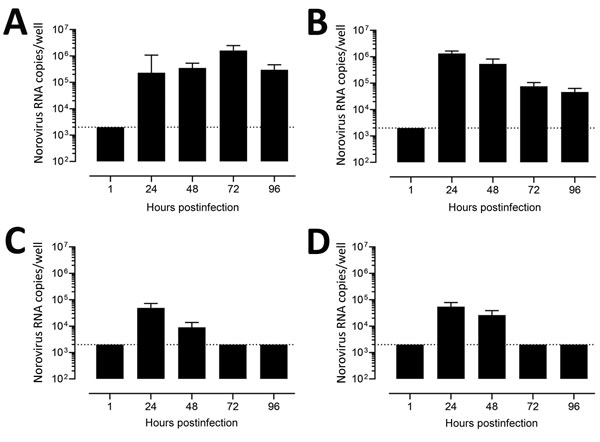
Figure 5. Confirmatory testing for human norovirus replication in human intestinal enteroids (HIEs). We inoculated jejunal HIE monolayers (J3 line) with A) GII.4 Pe-GII.4 Sydney (3.3 × 10⁵ RNA copies/well), B) GII.P12-GII.3 (5.3 × 10⁵ RNA copies/well), C) GII.P16-GII.2 (3.2 × 10⁵ RNA copies/well), or D) GII.Pg-GII.1 (9.3 × 10⁵ RNA copies/well). After 1 h at 37°C in 5% CO2, monolayers were washed, and media was replaced with differentiation medium and incubated at 37°C and 5% CO2. At 24, 48, and 72 hours postinfection, we removed the medium and added fresh differentiation media. At 96 hours postinfection, we removed the medium. We extracted RNA and quantified it by quantitative reverse transcription PCR from the supernatant at each time point. Data represent mean ± SD of 2 experiments with 3 wells for each time point. Dotted lines represent RT-qPCR limit of detection.

Main Article

Page created: July 18, 2018
Page updated: July 18, 2018
Page reviewed: July 18, 2018
The conclusions, findings, and opinions expressed by authors contributing to this journal do not necessarily reflect the official position of the U.S. Department of Health and Human Services, the Public Health Service, the Centers for Disease Control and Prevention, or the authors' affiliated institutions. Use of trade names is for identification only and does not imply endorsement by any of the groups named above.
file_external