Nasopharyngeal Pneumococcal Density during Asymptomatic Respiratory Virus Infection and Risk for Subsequent Acute Respiratory Illness
Leigh M. Howard, Yuwei Zhu, Marie R. Griffin, Kathryn M. Edwards, John V. Williams, Ana I. Gil, Jorge E. Vidal, Keith P. Klugman, Claudio F. Lanata, and Carlos G. Grijalva

Author affiliations: Vanderbilt University Medical Center, Nashville, Tennessee, USA (L.M. Howard, Y. Zhu, M.R. Griffin, K.M. Edwards, C.F. Lanata, C.G. Grijalva); University of Pittsburgh, Pittsburgh, Pennsylvania, USA (J.V. Williams); Instituto de Investigacion Nutricional, Lima, Peru (A.I. Gil, C.F. Lanata); Emory University, Atlanta, Georgia, USA (J.E. Vidal, K.P. Klugman)
Main Article
Figure 3
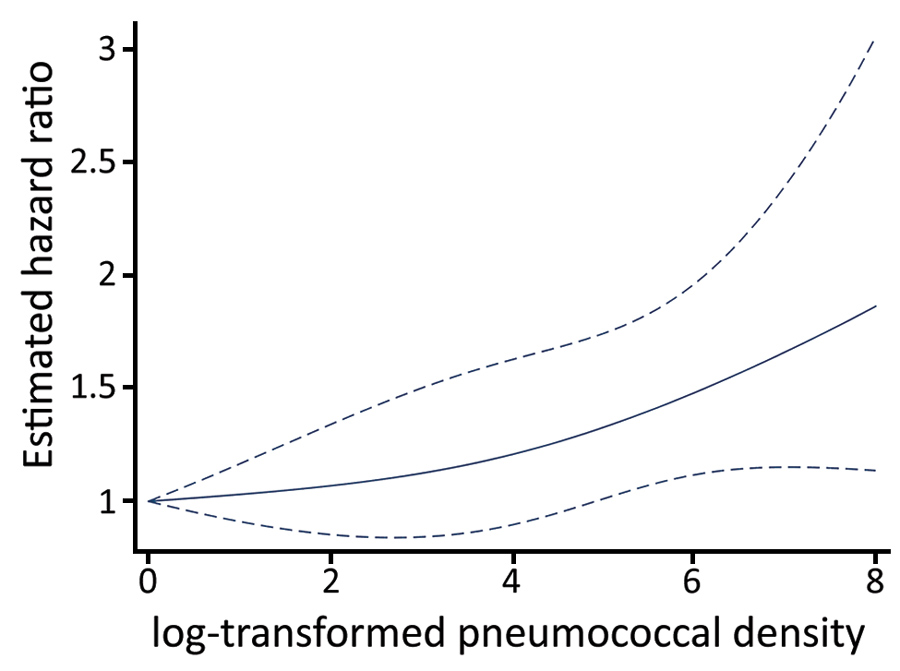
Figure 3. Association between asymptomatic pneumococcal densities and risk of subsequent acute respiratory illness among children <3 years of age, Respiratory Infections in Andean Peruvian Children study, May 2009–September 2011. Estimated hazard ratios correspond to comparisons of increasing log10-transformed pneumococcal density relative to the lowest detectable densities (p = 0.013). Solid lines represent the point estimates for the hazard ratio by log-transformed pneumococcal density; dashed lines represent 95% CIs. Estimates were obtained from a frailty model that adjusted for age, sex, month, prior antibiotic exposure, viral detection, and pneumococcal conjugate vaccination status. Pneumococcal densities were modeled by using restricted cubic splines to allow examination of nonlinear associations.
Main Article
Page created: October 15, 2019
Page updated: October 15, 2019
Page reviewed: October 15, 2019
The conclusions, findings, and opinions expressed by authors contributing to this journal do not necessarily reflect the official position of the U.S. Department of Health and Human Services, the Public Health Service, the Centers for Disease Control and Prevention, or the authors' affiliated institutions. Use of trade names is for identification only and does not imply endorsement by any of the groups named above.