Sand Fly–Associated Phlebovirus with Evidence of Neutralizing Antibodies in Humans, Kenya
David P. Tchouassi

, Marco Marklewitz, Edith Chepkorir, Florian Zirkel
1, Sheila B. Agha, Caroline C. Tigoi, Edith Koskei, Christian Drosten, Christian Borgemeister, Baldwyn Torto, Sandra Junglen
2 , and Rosemary Sang
2
Author affiliations: International Centre of Insect Physiology and Ecology, Nairobi, Kenya (D.P. Tchouassi, E. Chepkorir, S.B. Agha, C.C. Tigoi, B. Torto, R. Sang); Charité-Universitätsmedizin Berlin, Berlin, Germany (M. Marklewitz, F. Zirkel, C. Drosten, S. Junglen); German Center for Infection Research, Berlin (M. Marklewitz, F. Zirkel, C. Drosten, S. Junglen); Center for Virus Research, Kenya Medical Research Institute, Nairobi (E. Koskei, R. Sang); University of Bonn, Bonn, Germany (C. Borgemeister)
Main Article
Figure 3
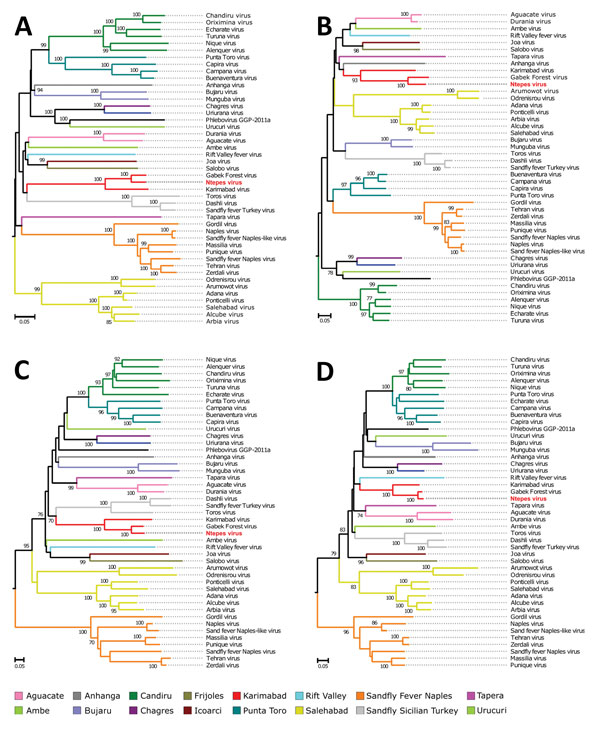
Figure 3. Phylogenetic relationship of novel sand fly–associated phlebovirus Ntepes virus from Kenya (red bold text) in relation to other selected members of the Phlebovirus genus. A) RNA-dependent RNA polymerase; B) nucleocapsid protein; C) glycoprotein Gn; D) glycoprotein Gc. The phylogenetic trees were inferred based on complete large, medium, and small protein sequences, applying maximum likelihood analysis in PhyML version 3.0 (http://www.atgc-montpellier.fr/phyml/versions.php) using the LG substitution model. Statistical support of the tree topology was evaluated by bootstrap resampling of the sequences 1,000 times. Sequences are identified by virus name and branch colors. Bootstrap values >70 are indicated at the nodes. Scale bar represents numbers of substitutions per site.
Main Article
Page created: March 17, 2019
Page updated: March 17, 2019
Page reviewed: March 17, 2019
The conclusions, findings, and opinions expressed by authors contributing to this journal do not necessarily reflect the official position of the U.S. Department of Health and Human Services, the Public Health Service, the Centers for Disease Control and Prevention, or the authors' affiliated institutions. Use of trade names is for identification only and does not imply endorsement by any of the groups named above.