Recombinant Nontypeable Genotype II Human Noroviruses in the Americas
Kentaro Tohma

, Cara J. Lepore, Juan I. Degiuseppe, Juan A. Stupka, Mayuko Saito, Holger Mayta, Mirko Zimic, Lauren A. Ford-Siltz, Robert H. Gilman, and Gabriel I. Parra
Author affiliations: US Food and Drug Administration, Silver Spring, Maryland, USA (K. Tohma, C.J. Lepore, L.A. Ford-Siltz, G.I. Parra); INEI-ANLIS “Dr. Carlos G. Malbrán,” Buenos Aires, Argentina (J.I. Degiuseppe, J.A. Stupka); Tohoku University Graduate School of Medicine, Sendai, Japan (M. Saito); Universidad Peruana Cayetano Heredia, Lima, Peru (H. Mayta, M. Zimic); Johns Hopkins University Bloomberg School of Public Health, Baltimore, Maryland, USA (R.H. Gilman)
Main Article
Figure
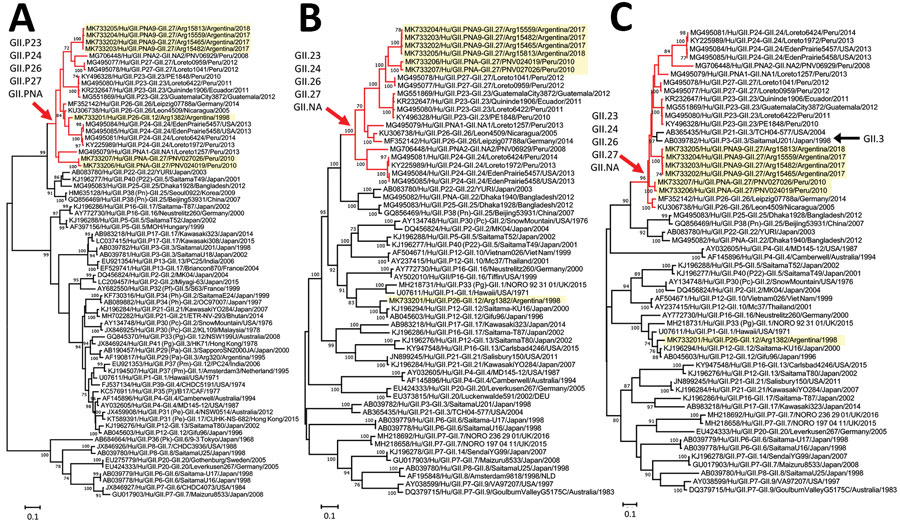
Figure. Phylogenetic analyses of nontypeable norovirus GII strains locally distributed in the Americas. Maximum-likelihood phylogenetic trees of the RNA-dependent RNA polymerase–-encoding nucleotide sequences (>771 nt) (A), major capsid protein–encoding nucleotide sequences (>1,605 nt) (B), and the minor capsid protein–encoding nucleotide sequences (>536 nt) (C) from human GII norovirus strains were created by using the Tamura-Nei model. Yellow highlighting indicates strains detected in this study; red branches and arrows indicate the divergence of a group of nontypeable GII strains reported in the Americas; and black arrow indicates GII.3 strains that diverged in the same branches with nontypeable GII strains. Bootstrap values (>70) from 100 replicates are shown on the nodes. GenBank accession numbers are shown. Scale bars indicate genetic distance (nucleotide substitutions/site).
Main Article
Page created: December 18, 2019
Page updated: December 18, 2019
Page reviewed: December 18, 2019
The conclusions, findings, and opinions expressed by authors contributing to this journal do not necessarily reflect the official position of the U.S. Department of Health and Human Services, the Public Health Service, the Centers for Disease Control and Prevention, or the authors' affiliated institutions. Use of trade names is for identification only and does not imply endorsement by any of the groups named above.