Nationwide External Quality Assessment of SARS-CoV-2 Molecular Testing, South Korea
Heungsup Sung
1
, Myung-Guk Han, Cheon-Kwon Yoo, Sang-Won Lee, Yoon-Seok Chung, Jae-Sun Park, Mi-Na Kim, Hyukmin Lee, Ki Ho Hong, Moon-Woo Seong, Kyunghoon Lee, Sail Chun, Wee Gyo Lee, Gye-Cheol Kwon, and Won-Ki Min
1
Author affiliations: University of Ulsan College of Medicine and Asan Medical Center, Seoul, South Korea (H. Sung, M.-N. Kim, S. Chun, W.K. Min); Korea Centers for Disease Control and Prevention, Chungcheongbuk-do, South Korea (M.-G. Han, C.-K. Yoo, S.-W. Lee, Y.-S. Chung, J.-S. Park); Yonsei University College of Medicine, Seoul (H. Lee); Seoul Medical Center, Seoul (K.-H. Hong); Seoul National University College of Medicine, Seoul (M.-W. Seong, K. Lee); Ajou University School of Medicine, Suwon, South Korea (W.G. Lee); Chungnam National University School of Medicine, Daejeon, South Korea (G.-C. Kwon)
Main Article
Figure 3
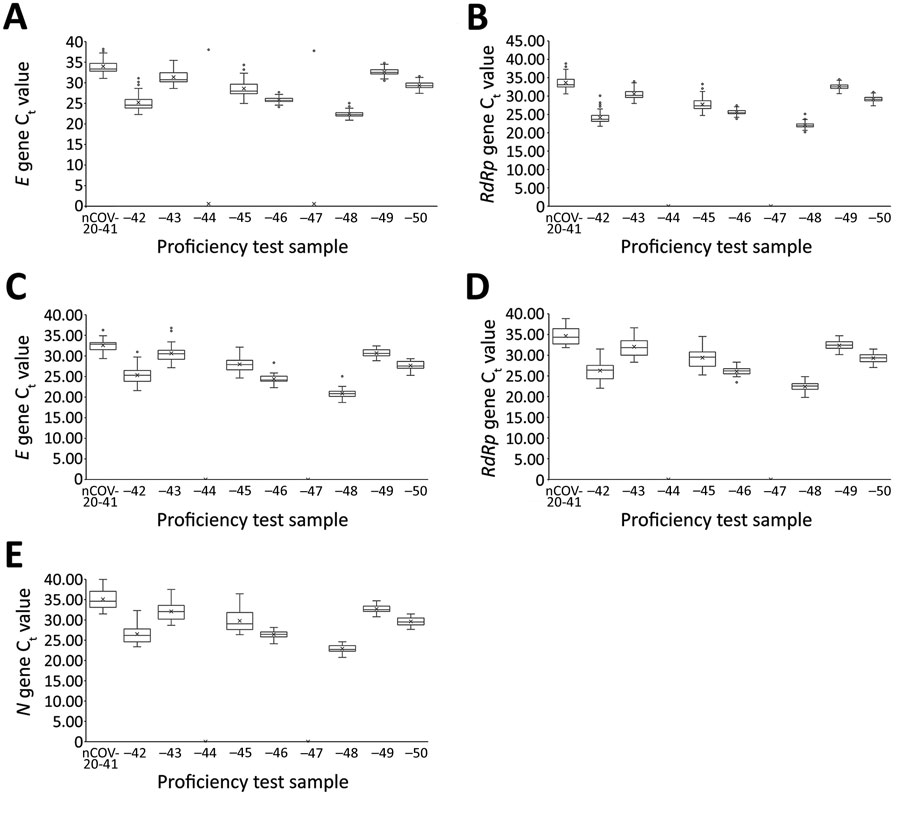
Figure 3. Semiquantitative real-time reverse transcription PCR Ct values for severe acute respiratory syndrome coronavirus 2 proficiency panel samples tested by PowerChek and Allplex 2019-nCoV kits, South Korea, March 23–27, 2020. Horizontal line within each box denotes the median value; x indicates the mean; top and bottom of box indicate third and first quartiles, respectively; error bars indicate minimum and maximum values; dots indicate outlier results. E gene (A) and RdRp gene (B) Ct values were from 67 laboratories using the PowerChek 2019-nCoV reagents; E gene (C), RdRp gene (D), and N gene (E) Ct values were from 38 laboratories using the Allplex 2019-nCoV reagents. Ct, cycle threshold.
Main Article
Page created: July 14, 2020
Page updated: September 17, 2020
Page reviewed: September 17, 2020
The conclusions, findings, and opinions expressed by authors contributing to this journal do not necessarily reflect the official position of the U.S. Department of Health and Human Services, the Public Health Service, the Centers for Disease Control and Prevention, or the authors' affiliated institutions. Use of trade names is for identification only and does not imply endorsement by any of the groups named above.