Skip directly to site content Skip directly to page options Skip directly to A-Z link Skip directly to A-Z link Skip directly to A-Z link
Volume 26, Number 12—December 2020
Synopsis

Animal Rabies Surveillance, China, 2004–2018

Ye Feng1, Yuyang Wang1, Weidi Xu, Zhongzhong Tu, Tingfang Liu, Minghe Huo, Yan Liu, Wenjie Gong, Zheng Zeng, Wen Wang, Yinhong Wei, and Changchun TuComments to Author 
Author affiliations: Academy of Military Medical Sciences, Changchun, China (Y. Feng, Y. Wang, W. Xu, Z. Tu, T. Liu, M. Huo, Y. Liu, W. Gong, C. Tu); Jilin Agricultural University, Changchun (W. Xu, T. Liu); Jilin University College of Veterinary Medicine, Changchun (M. Huo, W. Gong); Center for Animal Disease Control and Prevention of Chongqing, Chongqing, China (Z. Zeng); Animal Health Inspection Institute of Xinjiang Uygur Autonomous Region, Urumqi, China (W. Wang); Center for Animal Disease Control and Prevention of Alxa Youqi, Alxa, China (Y. Wei); Jiangsu Co-Innovation Center for the Prevention and Control of Important Animal Infectious Disease and Zoonoses, Yangzhou University, Yangzhou, China (C. Tu)

Main Article

Figure 3

Spatial–temporal dynamics of RABVs in China. Phylogenetic analysis of 1,118 sequences representing 1,118 rabies cases or virus strains, including those obtained in this study using different gene fragments, followed by chronological summation of each subclade. A–C) Distribution of identified subclades during 3 time periods: A) before 2004; B) 2004–2008; C) 2009–2018. D) Quantitative trends of 8 Chinese RABV subclades during 2004–2018. Exact numbers within each subclade are given below the circles. SEA, Southeast Asia.

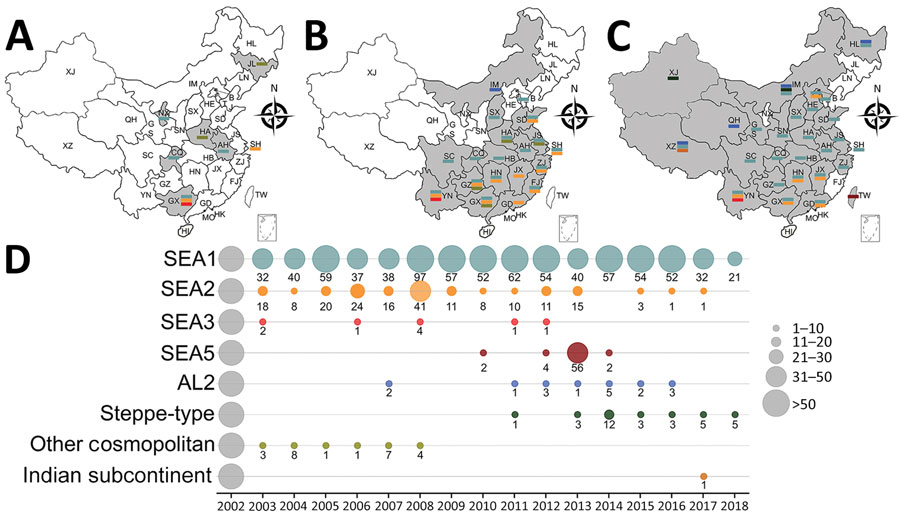
Figure 3. Spatial–temporal dynamics of RABVs in China. Phylogenetic analysis of 1,118 sequences representing 1,118 rabies cases or virus strains, including those obtained in this study using different gene fragments, followed by chronological summation of each subclade. A–C) Distribution of identified subclades during 3 time periods: A) before 2004; B) 2004–2008; C) 2009–2018. D) Quantitative trends of 8 Chinese RABV subclades during 2004–2018. Exact numbers within each subclade are given below the circles. SEA, Southeast Asia.

Main Article

1These authors contributed equally to this article.

Page created: September 01, 2020
Page updated: November 19, 2020
Page reviewed: November 19, 2020
The conclusions, findings, and opinions expressed by authors contributing to this journal do not necessarily reflect the official position of the U.S. Department of Health and Human Services, the Public Health Service, the Centers for Disease Control and Prevention, or the authors' affiliated institutions. Use of trade names is for identification only and does not imply endorsement by any of the groups named above.
file_external