Genomic Epidemiology of Severe Acute Respiratory Syndrome Coronavirus 2, Colombia
Katherine Laiton-Donato

, Christian Julián Villabona-Arenas, José A. Usme-Ciro, Carlos Franco-Muñoz, Diego A. Álvarez-Díaz, Liz Stephany Villabona-Arenas, Susy Echeverría-Londoño, Zulma M. Cucunubá, Nicolás D. Franco-Sierra, Astrid C. Flórez, Carolina Ferro, Nadim J. Ajami, Diana Marcela Walteros, Franklin Prieto, Carlos Andrés Durán, Martha Lucia Ospina-Martínez, and Marcela Mercado-Reyes
Author affiliations: Instituto Nacional de Salud, Bogotá, Colombia (K. Laiton-Donato, J.A. Usme-Ciro, C. Franco-Muñoz, D.A. Álvarez-Díaz, A.C. Flórez, C. Ferro, D.M. Walteros, F. Prieto, C.A. Durán, M.L. Ospina-Martínez, M. Mercado-Reyes); Centre for the Mathematical Modelling of Infectious Diseases (CMMID) and London School of Hygiene & Tropical Medicine, London, UK (C.J. Villabona-Arenas); Universidad Cooperativa de Colombia, Santa Marta, Colombia (J.A. Usme-Ciro); Universidad Industrial de Santander, Bucaramanga, Colombia (L.S. Villabona-Arenas); Imperial College-London, London, UK (S. Echeverría-Londoño, Z.M. Cucunubá); Instituto de Investigación de Recursos Biológicos Alexander von Humboldt, Colombia (N. Franco-Sierra); Baylor College of Medicine, Houston, Texas, USA (N.J. Ajami)
Main Article
Figure 4
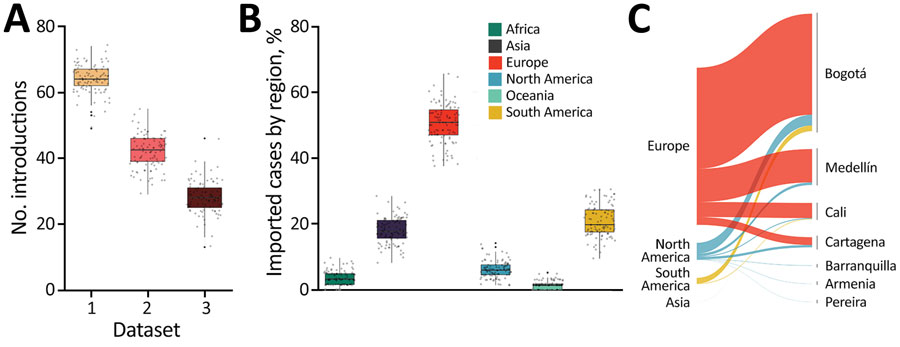
Figure 4. Potential routes of importation for SARS-CoV-2, Colombia. A) The number of transition changes into Colombia following migration inference by using all available sequences per region (dataset 1); retaining several sequences per region, when possible, equal to the number of sequences available for Colombia (dataset 2); and 50 sequences per region and all sequences from Colombia (dataset 3). Box top and bottom lines indicate 25th and 75th percentiles; horizontal lines within boxes indicate means; error bars indicate SDs. B) Geographic source attribution for every transition into Colombia derived from the migration inference using all the available sequences per region. Box top and bottom lines indicate 25th and 75th percentiles; horizontal lines within boxes indicate means; error bars indicate SDs. C) Geographic contribution inferred by using air travel data per country aggregated by region.
Main Article
Page created: September 28, 2020
Page updated: November 23, 2020
Page reviewed: November 23, 2020
The conclusions, findings, and opinions expressed by authors contributing to this journal do not necessarily reflect the official position of the U.S. Department of Health and Human Services, the Public Health Service, the Centers for Disease Control and Prevention, or the authors' affiliated institutions. Use of trade names is for identification only and does not imply endorsement by any of the groups named above.