Skip directly to site content Skip directly to page options Skip directly to A-Z link Skip directly to A-Z link Skip directly to A-Z link
Volume 26, Number 4—April 2020
Research

Comprehensive Profiling of Zika Virus Risk with Natural and Artificial Mitigating Strategies, United States

Michael J. Mina1, L. Beryl Guterman1Comments to Author , Kristen E. Allen, and Saad B. Omer
Author affiliations: Harvard T.H. Chan School of Public Health, Boston, Massachusetts, USA (M.J. Mina); Harvard Medical School, Boston (M.J. Mina); Jacobs School of Medicine and Biomedical Sciences, University at Buffalo, Buffalo, New York, USA (L.B. Guterman); Emory University, Atlanta, Georgia, USA (L.B. Guterman, K.E. Allen); Yale Institute for Global Health, New Haven, Connecticut, USA (S.B. Omer); Yale School of Medicine, New Haven (S.B. Omer); Yale School of Public Health, New Haven (S.B. Omer)

Main Article

Figure 3

Zika prevention and control strategies, United States. For each county in the United States including Puerto Rico, classes of prevention or control strategies were assessed, including (A–C) reductions in human–vector contact, (D–F) adult vector depletion, and (G–I) vaccination. A, D, G) Proportion of index cases initiating >1 transmission event versus extent of each intervention. Each line represents the statewide average across each of the constituent county’s median simulations. B, E, H) Hi

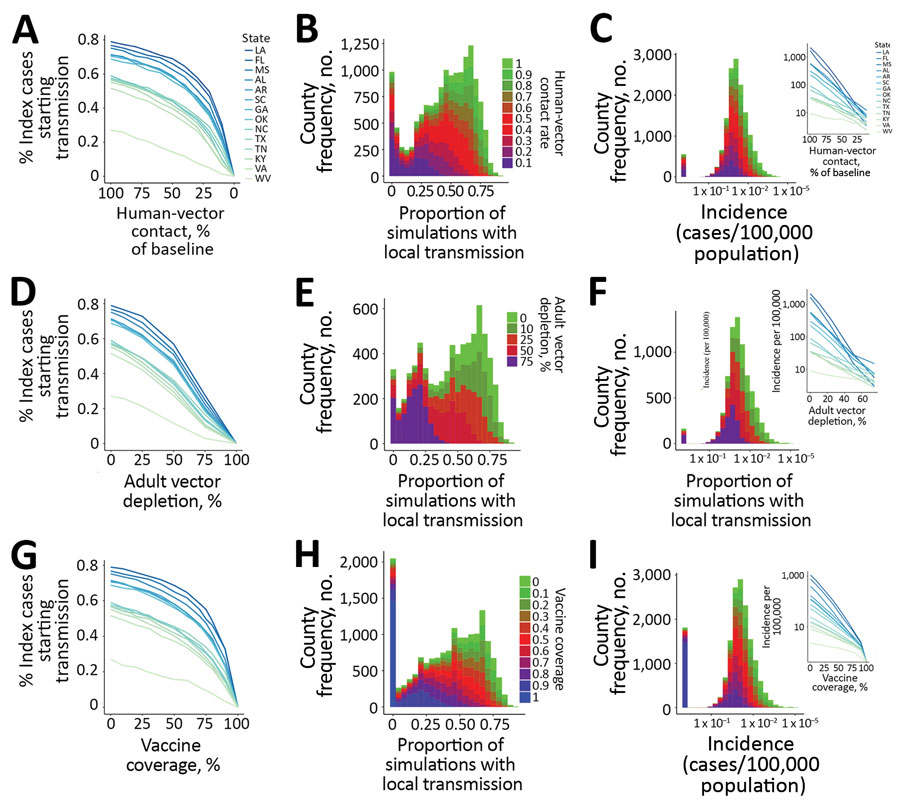
Figure 3. Zika prevention and control strategies, United States. For each county in the United States including Puerto Rico, classes of prevention or control strategies were assessed, including (A–C) reductions in human–vector contact, (D–F) adult vector depletion, and (G–I) vaccination. A, D, G) Proportion of index cases initiating >1 transmission event versus extent of each intervention. Each line represents the statewide average across each of the constituent county’s median simulations. B, E, H) Histograms depicting number of counties versus probability of permitting >1 transmission event from the index case, color coded by the level of each respective intervention. C, F, I) Histogram showing the number of counties versus incidence across levels of respective intervention (color coding as in panels B, E, and H). Insets in panels C, F, and I show incidence (on a log-linear scale) versus extent of each respective interventions.

Main Article

1These authors contributed equally to this article.

Page created: March 17, 2020
Page updated: March 17, 2020
Page reviewed: March 17, 2020
The conclusions, findings, and opinions expressed by authors contributing to this journal do not necessarily reflect the official position of the U.S. Department of Health and Human Services, the Public Health Service, the Centers for Disease Control and Prevention, or the authors' affiliated institutions. Use of trade names is for identification only and does not imply endorsement by any of the groups named above.
file_external