Skip directly to site content Skip directly to page options Skip directly to A-Z link Skip directly to A-Z link Skip directly to A-Z link
Volume 27, Number 1—January 2021
Research

Performance of Nucleic Acid Amplification Tests for Detection of Severe Acute Respiratory Syndrome Coronavirus 2 in Prospectively Pooled Specimens

Hannah Wang, Catherine A. Hogan, Jacob A. Miller, Malaya K. Sahoo, ChunHong Huang, Kenji O. Mfuh, Mamdouh Sibai, James Zehnder, Brendan Hickey, Nasa Sinnott-Armstrong, and Benjamin A. PinskyComments to Author 
Author affiliations: Stanford University School of Medicine, Stanford, California, USA (H. Wang, C.A. Hogan, J.A. Miller, M.K. Sahoo, C. Huang, J. Zehnder, N. Sinnott-Armstrong, B.A. Pinsky); Stanford Health Care, Stanford (K.O. Mfuh, M. Sibai, B.A. Pinsky); Stanford University, Stanford (N. Sinnott-Armstrong)

Main Article

Figure 2

Performance of nucleic acid amplification tests for detection of severe acute respiratory syndrome coronavirus 2 in prospectively pooled specimens. Passing-Bablok regression and Bland-Altman plots for pools of 8 containing only 1 positive sample, tested by A and B) pooled LDT versus individual LDT (n = 23) (A, B); pooled Panther Fusion versus individual LDT (n = 25) (C, D); and pooled Panther Fusion versus pooled LDT (n = 32) (E, F). For the Passing-Bablok regression plots (A, C, and E), the solid line indicates the line of regression. 95% CIs are shaded in gray. The dashed line indicates the line of identity. The slope and intercept of the regression line are reported with 95% CIs in parentheses. For the Bland-Altman plots (B, D, and F), the solid line represents the mean difference in Ct value. 95% limits of agreement are shaded in gray. Panther Fusion is from Hologic (https://www.hologic.com). Ct, cycle threshold; LDT, laboratory-developed test; LOA, limits of agreement.

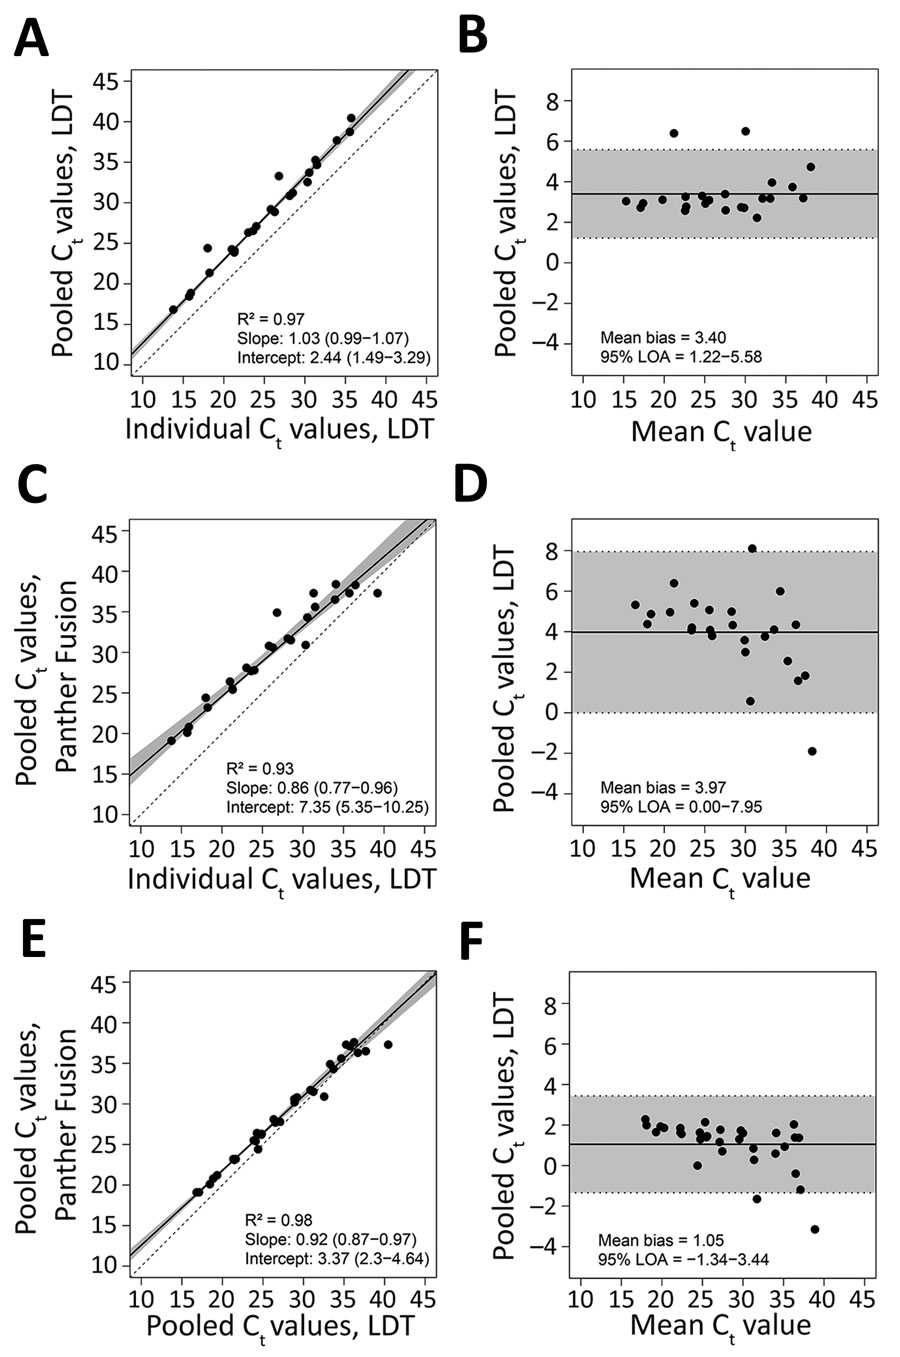
Figure 2. Performance of nucleic acid amplification tests for detection of severe acute respiratory syndrome coronavirus 2 in prospectively pooled specimens. Passing-Bablok regression and Bland-Altman plots for pools of 8 containing only 1 positive sample, tested by A and B) pooled LDT versus individual LDT (n = 23) (A, B); pooled Panther Fusion versus individual LDT (n = 25) (C, D); and pooled Panther Fusion versus pooled LDT (n = 32) (E, F). For the Passing-Bablok regression plots (A, C, and E), the solid line indicates the line of regression. 95% CIs are shaded in gray. The dashed line indicates the line of identity. The slope and intercept of the regression line are reported with 95% CIs in parentheses. For the Bland-Altman plots (B, D, and F), the solid line represents the mean difference in Ct value. 95% limits of agreement are shaded in gray. Panther Fusion is from Hologic (https://www.hologic.com). Ct, cycle threshold; LDT, laboratory-developed test; LOA, limits of agreement.

Main Article

Page created: September 29, 2020
Page updated: December 21, 2020
Page reviewed: December 21, 2020
The conclusions, findings, and opinions expressed by authors contributing to this journal do not necessarily reflect the official position of the U.S. Department of Health and Human Services, the Public Health Service, the Centers for Disease Control and Prevention, or the authors' affiliated institutions. Use of trade names is for identification only and does not imply endorsement by any of the groups named above.
file_external