Volume 27, Number 1—January 2021
Research
Cellular Immunity in COVID-19 Convalescents with PCR-Confirmed Infection but with Undetectable SARS-CoV-2–Specific IgG
Sina Schwarzkopf, Adalbert Krawczyk, Dietmar Knop, Hannes Klump, Andreas Heinold, Falko M. Heinemann, Laura Thümmler, Christian Temme, Marianne Breyer, Oliver Witzke, Ulf Dittmer, Veronika Lenz, Peter A. Horn, and Monika Lindemann
Figure 1
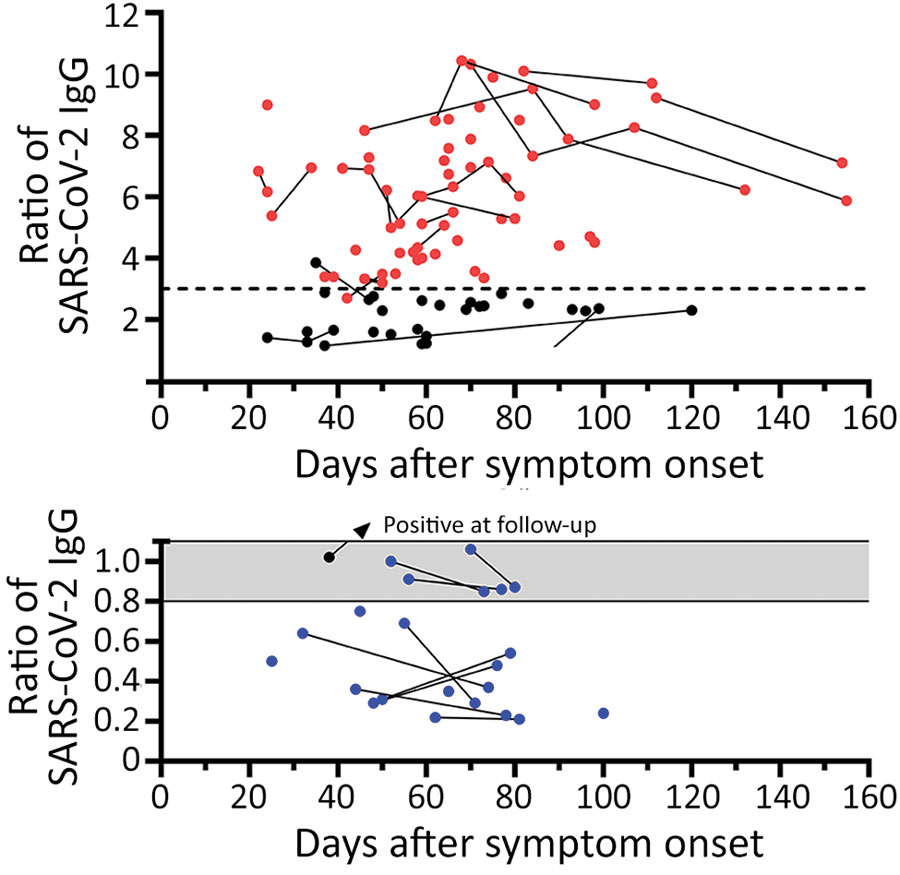
Figure 1. Distribution of SARS-CoV-2 IgG in 78 potential convalescent-plasma donors with PCR-confirmed infection, Germany. Red dots represent study participants with antibody ratio >3; black dots, participants with a ratio of 1.1–3; blue dots, participants with ratio <1.1. Sequential data are connected. Horizontal dashed line indicates a ratio of 3. A) Antibody ratios in the positive or intermediate range. B) Antibody ratios in the borderline or negative range. Gray shading indicates borderline values (ratio of 0.8–1.1); scale is adjusted to enhance data visualization. SARS-CoV-2, severe acute respiratory syndrome coronavirus 2.
Page created: October 15, 2020
Page updated: December 21, 2020
Page reviewed: December 21, 2020
The conclusions, findings, and opinions expressed by authors contributing to this journal do not necessarily reflect the official position of the U.S. Department of Health and Human Services, the Public Health Service, the Centers for Disease Control and Prevention, or the authors' affiliated institutions. Use of trade names is for identification only and does not imply endorsement by any of the groups named above.