Skip directly to site content Skip directly to page options Skip directly to A-Z link Skip directly to A-Z link Skip directly to A-Z link
Volume 27, Number 1—January 2021
Research

Recency-Weighted Statistical Modeling Approach to Attribute Illnesses Caused by 4 Pathogens to Food Sources Using Outbreak Data, United States

Michael B. BatzComments to Author , LaTonia C. Richardson, Michael C. Bazaco, Cary Chen Parker, Stuart J. Chirtel, Dana Cole1, Neal J. Golden, Patricia M. Griffin, Weidong Gu2, Susan K. Schmitt3, Beverly J. Wolpert, Joanna S. Zablotsky Kufel, and R. Michael Hoekstra4
Author affiliations: US Food and Drug Administration, College Park, Maryland, USA (M.B. Batz, M.C. Bazaco, C. Chen Parker, S.J. Chirtel, B.J. Wolpert); Centers for Disease Control and Prevention, Atlanta, Georgia, USA (L.C. Richardson, D. Cole, P.M. Griffin, W. Gu, R.M. Hoekstra); US Department of Agriculture, Washington, DC, USA (N.J. Golden, S.K. Schmitt, J.S. Zablotsky Kufel)

Main Article

Figure 3

Estimated percentages of foodborne illnesses attributed to food categories and 90% credibility intervals (error bars) for Salmonella, Escherichia coli O157, Listeria monocytogenes, and Campylobacter, based on analysis of single-pathogen, single-food category outbreaks, Foodborne Disease Outbreak Surveillance System, United States, 1998–2012. Percentages are presented in descending order. Open squares indicate that no illnesses were attributed to that food category because no outbreaks were reported for that pathogen in that food category during the study period. Estimates calculated by using analysis of variance model–estimated outbreak illnesses for single pathogen, single food category outbreaks occurring during 1998–2012, with down-weighting of outbreaks that occurred during 1998–2007.

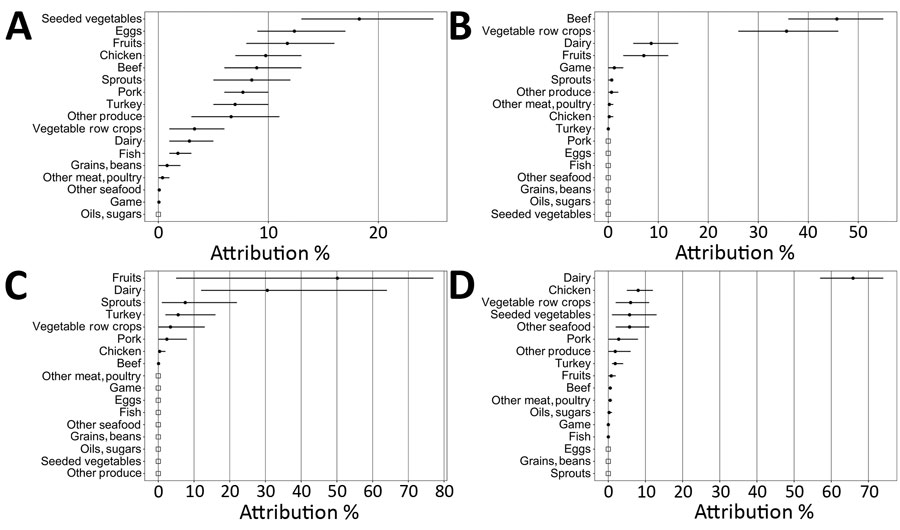
Figure 3. Estimated percentages of foodborne illnesses attributed to food categories and 90% credibility intervals (error bars) for Salmonella, Escherichia coli O157, Listeria monocytogenes, and Campylobacter, based on analysis of single-pathogen, single-food category outbreaks, Foodborne Disease Outbreak Surveillance System, United States, 1998–2012. Percentages are presented in descending order. Open squares indicate that no illnesses were attributed to that food category because no outbreaks were reported for that pathogen in that food category during the study period. Estimates calculated by using analysis of variance model–estimated outbreak illnesses for single pathogen, single food category outbreaks occurring during 1998–2012, with down-weighting of outbreaks that occurred during 1998–2007.

Main Article

1Current affiliation: US Department of Agriculture, Fort Collins, Colorado, USA.

2Current affiliation: US Department of Defense, Bethesda, Maryland, USA.

3Current affiliation: US Department of Veterans Affairs, Palo Alto, California, USA.

4Retired.

Page created: November 23, 2020
Page updated: December 21, 2020
Page reviewed: December 21, 2020
The conclusions, findings, and opinions expressed by authors contributing to this journal do not necessarily reflect the official position of the U.S. Department of Health and Human Services, the Public Health Service, the Centers for Disease Control and Prevention, or the authors' affiliated institutions. Use of trade names is for identification only and does not imply endorsement by any of the groups named above.
file_external